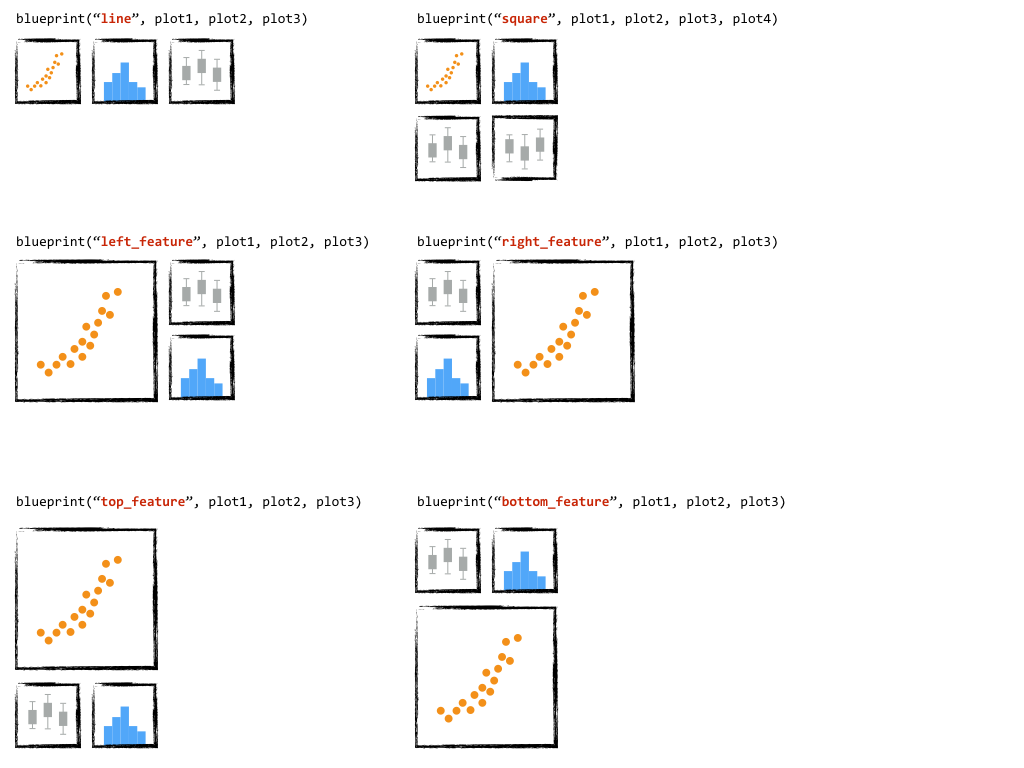
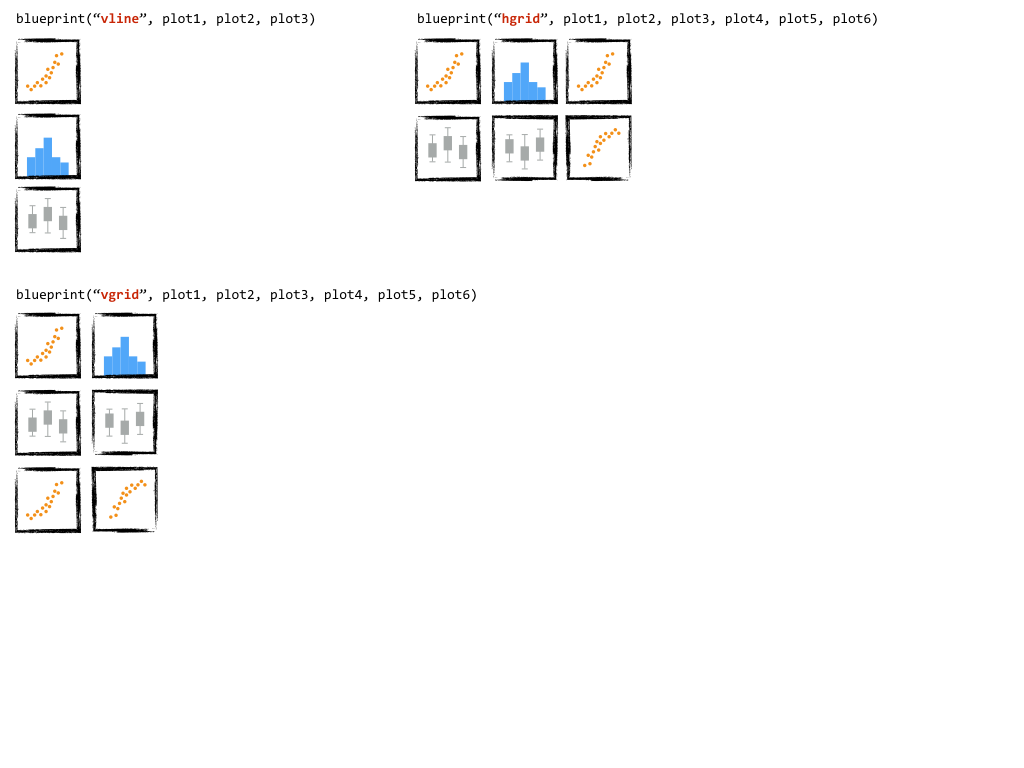
layout package for ggplot2, built on top of the cowplot package
The purpose of this package is to provide an efficient interface for laying out multiple ggplot2 graphs on a single panel using common layout patterns. It's very much a work in progress, but the basics are there.
library("devtools")
devtools::install_github("zaczap/bluepRint")library(ggplot2)
library(bluepRint)
plot1 = ggplot(mtcars, aes(x=wt, y=mpg)) + geom_point() + labs(x='weight',y='miles per gallon (mpg)') + theme_bw()
plot2 = ggplot(mtcars, aes(x=mpg)) + geom_histogram() + labs(x='miles per gallon (mpg)', y='count') + theme_bw()
panel = blueprint('line', plot1, plot2)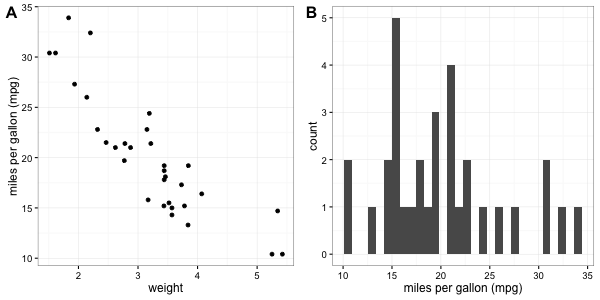
or a more complicated layout can easily be achieved:
plot3 = ggplot(mtcars, aes(x=wt)) + geom_histogram() + labs(x='weight', y='count') + theme_bw()

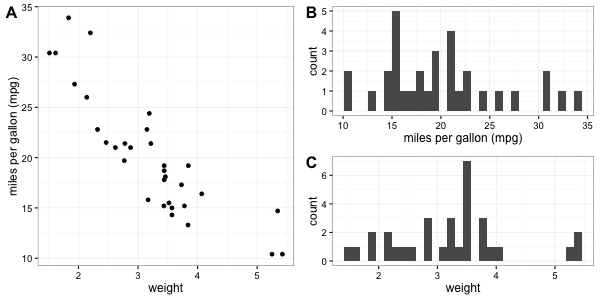
panel = blueprint('left_feature', plot1, plot2, plot3)