Allows rendering of mathematics stuff in ASCII for maximum portability.
Functions which generate ASCII representations of symbols/diagrams return numpy arrays of characters. Use mathscii.display to print them. Hopefully I'll add more symbols, and ways of combining them nicely with operators (think fractions, exponentiation etc.)
from mathscii import *

display(matrix([[1, 2, dots(), "n"],
                [2, 3, dots(), "n + 1"],
                [vdots(), vdots(), ddots(), vdots()],
                ["n", "n + 1", dots(), "2n - 1"]]))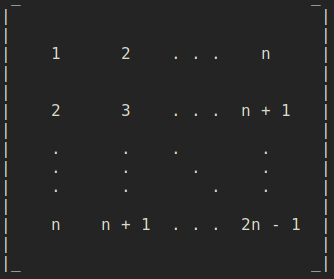
from mathscii import *

fig1 = Diagram()

fig1.polygon(0, 3, 5, 2, 2, 7)
fig1.circle(10, 10, 3)
fig1.label(10, 10, "O")
fig1.label(5.5, 2, "A")
fig1.label(2, 7.7, "B")
fig1.label(-0.5, 3, "C")

display(fig1.draw())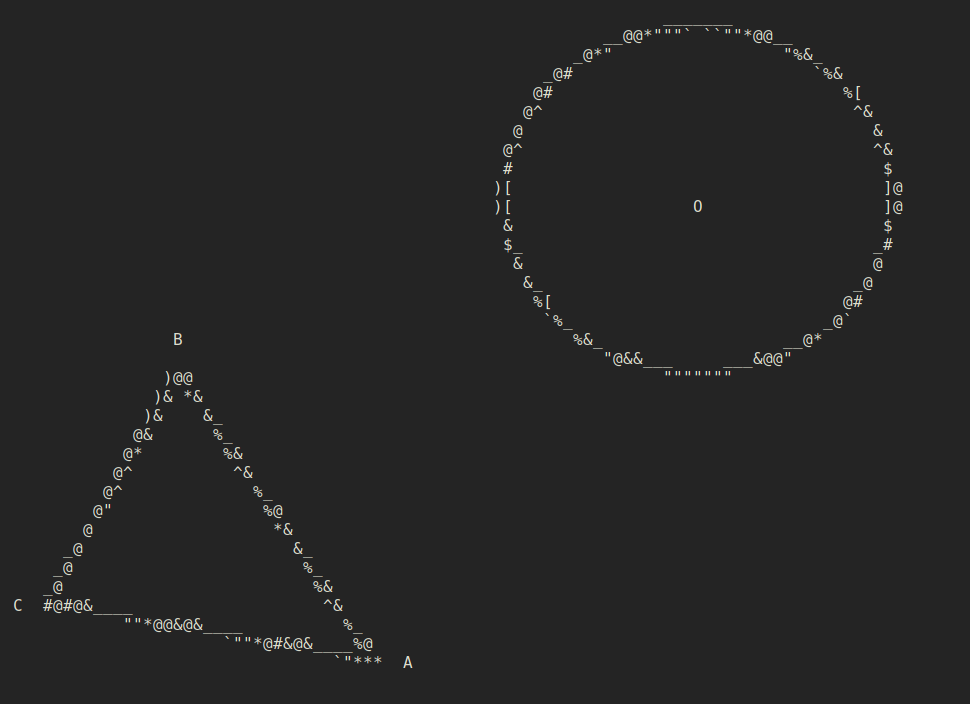
from mathscii import *

display(frac(1, add(1, parentheses(frac(1, add(1, parentheses(frac(1, add(1, dots(3, 1))))))))))
- numpy
For diagrams:
- matplotlib
- PIL
- A TTF font: pass the path to
mathscii.diagramormathscii.Diagram.__init__. By default the path is/usr/share/fonts/droid/DroidSansMono.ttf.