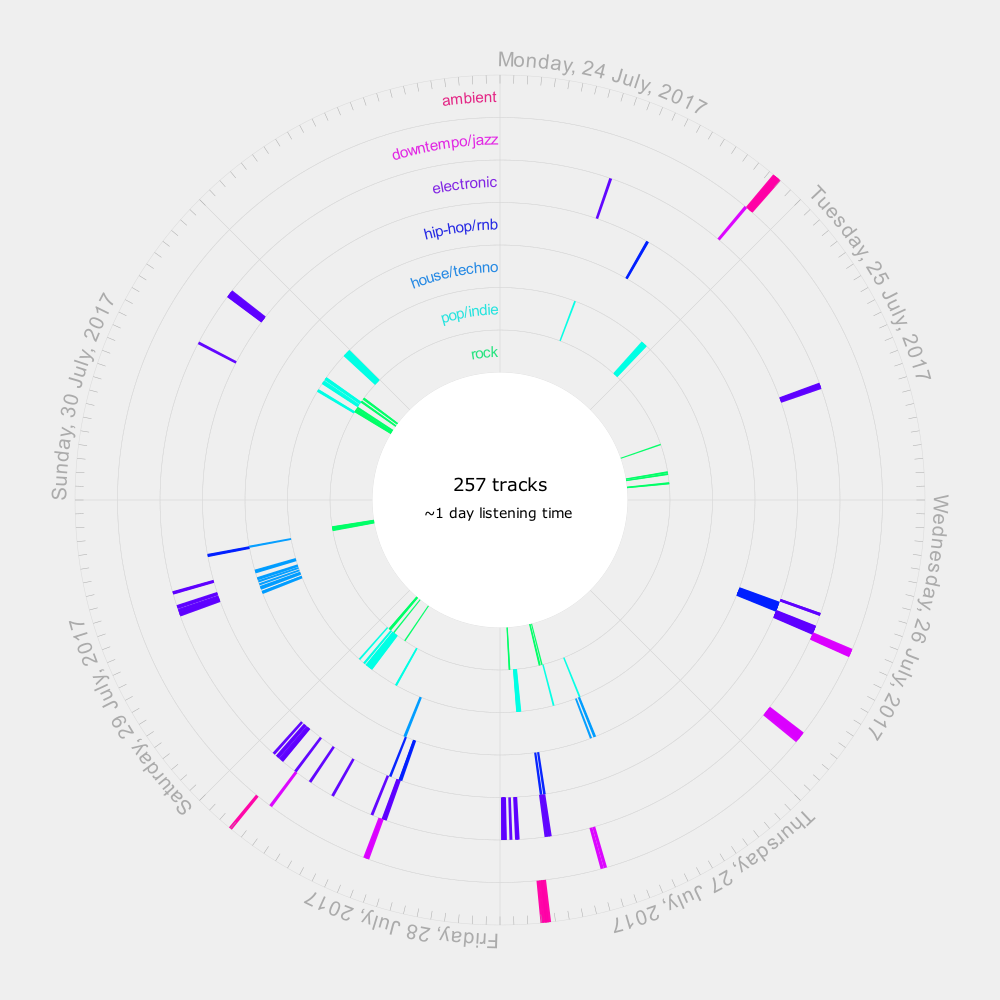
Uses R to scrape from Last.fm and NodeBox to generate a radial visualisation on tracks listened to with tags.
Currently a little manual data handling is required, as the R script only adds the most popular tag for each artist as the tag for each track. Sometimes the top tag is nonsense and there are usually too many individual tags to fit onto the plot.
Tracks which have been scrobbled and mistagged might have incorrect last.fm tags.
Note: The text in the middle of the circle (with total number of tracks and listening time) is manually created