Project accepted on AR2B, experiment will be traveling to the International Space Station. For any questions, please contact this experiment's Project Manager, Michael Blunt at michaelbblunt@gmail.com.
“Smells Like Particulate Matter” is Palmetto Scholars Academy’s team in the Data Evaluation From Testing via an Educational Challenge with Teachers and Students (DETECTS) initiative with the University of Alabama in Huntsville (UAH). The DETECTS mission will take place in ACES RED 2B (AR2B) on an external pallet attached to the International Space Station (ISS). AR2B’s primary objective is to study quantum entanglement technology in space satellite communications. The primary purpose of DETECTS on AR2B is to investigate the use of low-cost commercial-off-the-shelf (COTS) hardware. The team’s mission is to develop an experiment that utilizes a Raspberry Pi computer in conjunction with sensors to fulfill a scientific objective. The team must select a scientific objective to build an experiment around, program the Pi, and confirm that it meets all functional and environmental requirements through testing. In addition, they must professionally communicate their progress with a panel of evaluators. All DETECTS teams were given a detailed Request for Experiment (RFE) and Interface Control Document (ICD) with the requirements that must be met in order to qualify for a slot on AR2B. The experiment would be stored in AR2B, where it would generate and relay data back to the team for evaluation. The project requirements for the team’s experiment is broken down into four categories. The team must follow mechanical and spatial requirements by keeping the experiment no larger than 65 mm by 56.5 mm by 19 mm, and by not modifying the existing Pi mounting configuration or the existing 40W connector pins. Electrical requirements detail that the experiment must be compatible with the existing 40W pinout and that the team cannot use pins 30 or 31. Mechanical aspects of the experiment must be stationary and solid to avoid any damage to the experiment and AR2B. The team cannot include: liquids or gasses of any kind, organic material, loose or powdered material, high voltage equipment (>28V), EMF producing equipment, pressurized vessels, moving parts, reconfigured pinouts, fracturing or shattering materials, batteries, or electrolytic capacitors. In terms of software, all programs must be able to interface and collect data from a Pi HAT and not exceed a data rate of 5 kilobytes per second (kBps). Also, the team must be able to communicate with the AR2B flight computer via the team’s unique JSON packets passed to UAH’s team sender program through placement in the /tmp/experiment directory.
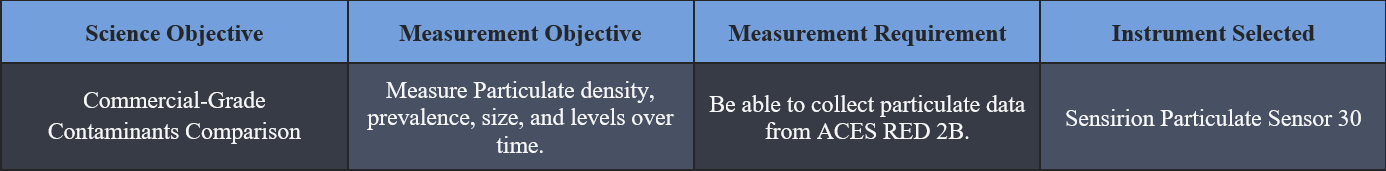
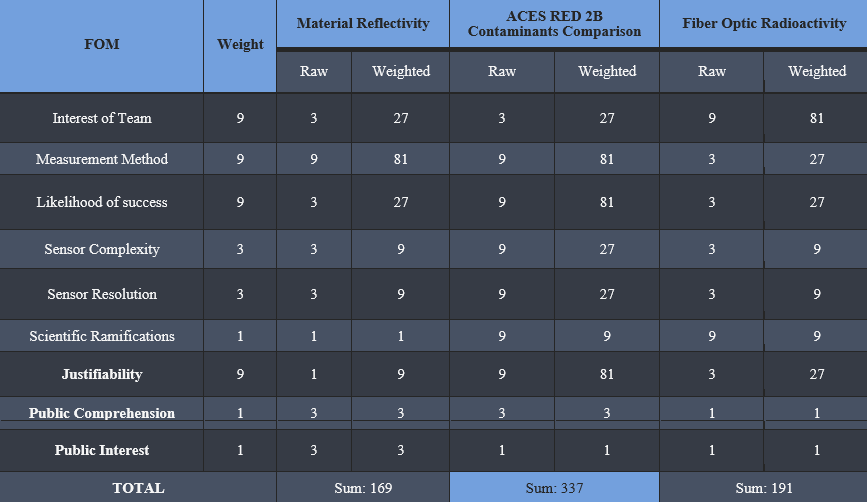
The team came up with a total of three potential science objectives, “Material Reflectivity,” “Commercial Grade Contaminants Comparison,” and “Fiber Optic Radioactivity.” Material Reflectivity would measure the reflectivity of specific materials with a reflectance sensor within the near-zero lux environment of the AR2B tray. Many consumer technology devices, such as screens, use reflectivity to function, so specific research on reflectivity can assist in material selection for future spaceflight missions. Commercial Grade Contaminants Comparison would be studying and assessing the particulate matter present on AR2B utilizing a particulate matter sensor. There is a significant price difference between consumer and professional grade particulate sensors, and analyzing a consumer grade sensor will establish whether or not this differential is warranted. Fiber Optic Radioactivity would study the effects of background radiation on fiber optic cabling by utilizing a simple voltage output and input to measure any losses. This is key to figuring out the effects of spatial radiation on connectivity with fiber optics. In order to choose a scientific objective to pursue, the team used a science objective trade study (Table 2) with weighted figures of merit (FOMs). The FOMs assigned by UAH were Interest of Team, Measurement Method, Likelihood of Success, Sensor Complexity, Sensor Resolution, and Scientific Ramifications. In addition, the team added three FOMs: Justifiability, Public Interest, and Public Comprehension. All FOMs were given a weight of either 1, 3, or 9. After careful consideration and research, “Commercial Grade Contaminants Comparison” won with a weighted score of 337, due to its high scores in Measurement Method, Likelihood of Success, and Interest of Team. The high score in Measurement Method was due to the highly tested nature and quality of the instrument, and high scores in likelihood of success are due to the stability of the experiment’s design in concept and programming. “Commercial Grade Contaminants Comparison” will establish an experiment to compare the quality and quantity of data collected by commercial-grade vs professional-grade equipment. In order to do this, the team will assess particulate density, prevalence, size, and levels over time while onboard AR2B in order to proceed with a data comparison analysis. All of this will be done in order to gather data on the difference in both the quality and quantity of measurements between consumer and professional-grade sensor technology. After some research on different types of sensing technology, the team has come to believe that the inaccuracy of data generated by commercial-grade sensing technology will not be impressive enough to warrant the costs typically associated with the more expensive professional equipment. The goal in mind for this experiment is to determine whether or not commercial-grade sensors and COTS (Commercial Off the Shelf) hardware are accurate and reliable enough to be used in future missions. If the data gathered from the prospective experiment provides evidence in support of this claim, COTS equipment may be able to replace or supplement far more expensive sensors that have similar purposes. In order to complete the science objective, the experiment must be able to measure particulate density, prevalence, size, and levels over time. Also, the sensor must be able to take measurements on AR2B. After significant research, the team decided on the Sensirion Particulate Sensor 30 (SPS30), a consumer-grade particulate matter sensor (See Science traceability Matrix, Table 1). The SPS30 features a compact design, measuring 40.6 mm x 40.6 mm x 12.2 mm, and can measure particulate matter as small as 0.3 μm, a figure slightly better than the posted value for the ISS’s Analysing Interferometer for Ambient Air (ANITA), which currently serves as the ISS’s air quality monitoring system. The SPS30 also features an impressive accuracy of +/-10 μg/m3, as well as a long term accuracy drift of +/- 1.25 μg/m3 per year and a Pi compatible digital output. The SPS30’s small profile combined with very high accuracy and reliability ultimately made it the best fit for the team’s experiment. Due to the design of the SPS30 and the microgravity conditions the experiment will experience, the experiment will be able to take highly accurate measurements simply by running and has no notable limiting requirements. In Table 2, the team describes the process through which the team used to determine the best sensor for their science objective. The reason the team chose to research a particulate matter sensor, in particular, is based on research the team has done into the ISS’s current air quality monitoring system, the aforementioned ANITA. It is a system that can measure particulate matter up to the “high parts per billion” or >0.5 μm range, as well as to detect over 32 different types of harmful trace gasses. It was developed in the early 2000s, and presumably cost multiple millions of dollars to produce, engineer, design, and qualify. This team’s experiment includes a $45 sensor that can detect smaller particles (>0.3 μm) with a higher degree of accuracy. This team believes that the current particulate matter sensors used in spaceflight missions may be outdated; in addition, the laser-based measurement technology as seen in sensors like the SPS30 may prove to be better suited for missions than the infrared technology used in older sensors such as the one integrated into ANITA. This team believes that an SPS30 may be able to produce results with comparable or higher accuracy to the existing ANITA system, with the added perk of a price point less than 0.001% of the cost of the existing technology (assuming the particulate sensor in ANITA cost at least 5 million to develop, engineer, and implement). With this stated, the team is by no means questioning the accuracy or engineering of the ANITA, as sensing particulate matter is just one of many functions it performs. The above explanation of the ANITA is by no means all-encompassing, and a device like SPS30 could never replace such a system by itself; However, validating the accuracy and usability of a COTS device such as the SPS30 aligns very well with the secondary objective of AR2B, could potentially have very important implications in terms of future mission costs, and could also lead to new, more accurate systems being created with these new technologies.
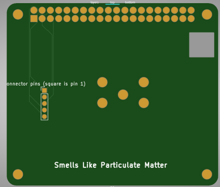
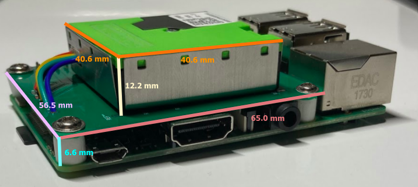
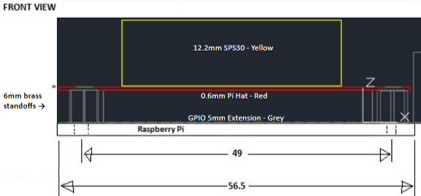
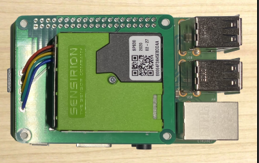
The team’s mission utilizes an SPS30 mounted on a custom Raspberry Pi Hardware Attached on Top (HAT). The HAT is a printed circuit board (PCB) with dimensions of 65 x 56.5 x 0.8 mm. This HAT integrates the selected sensor, the SPS30, by mounting it via screws and a connector for the sensor. This allows for a stable mount throughout the course of the mission. The HAT design also allows for the use of the 5 pin connector standard utilized by the SPS30 for ease of installation and troubleshooting. Additionally, the HAT meets all the requirements for a Pi HAT, such as utilizing all 40 general-purpose input/output (GPIO) pins and following all solder trace placement guidelines. The HAT is mounted utilizing 6mm standoffs, to ensure the most stability when AR2B encounters inclement conditions. As depicted in Figures 1, 2, and 3, the SPS30 will be roughly centered on the Pi HAT and will be connected to the GPIO pins via the traces and solder connection pads integrated into the PCB board.
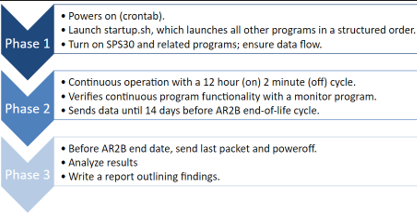
This experiment divides its concept of operations into three phases. Phase 1 is dedicated to powering up and utilizes a cron job to launch all of the required programs. During this phase, the SPS30 also powers on, and the monitor program ensures that all programs launched successfully. During Phase 2, the experiment operates for twelve hours at a time, then stops and restarts for approximately two minutes. This restart period ensures that if any errors are missed by the monitor program during the mission, a minimal amount of data would be lost. Additionally, the monitoring program performs a soft restart (SPS30 power is not cut) if an error occurs. During this phase, the experiment sends data to the AR2B data handling system at a max data rate of 0.5 kilobytes per second. During Phase 3, the experiment sends its last data packet and powers off approximately 14 days before the end date of AR2B. This is to ensure that little data is lost, while also ensuring that the team does not interfere with AR2B’s end of life plans. After the team receives all the data from the experiment, the team will look for any statistically significant data present, and then create a report outlining the findings, and the implications thereof. This team’s concept of operations is depicted visually in Figure 4.
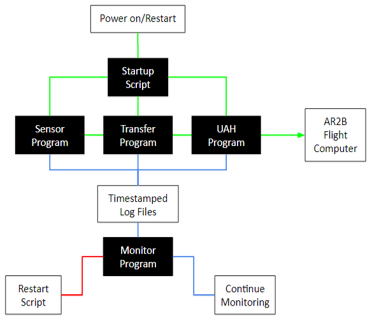
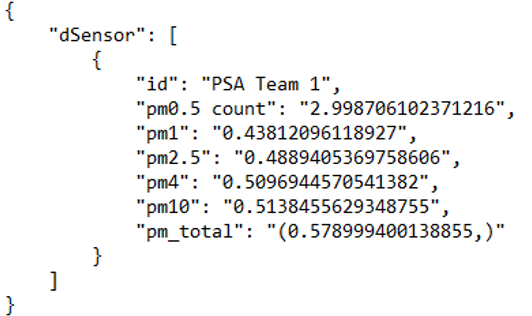
The team’s mission program consists of five crucial programs: A startup program, a sensor program, a transfer program, a monitor program, and UAH’s program. Figure 5 shows the basic operation of the programs. In Figure 5, the team uses green lines to represent the data cycle of the program, red lines to represent a triggered restart, and the blue lines represent the log cycle. The startup program is launched as part of the Pi’s bootup sequence through a feature built into the native Linux-based operating system called a cron job. This cron job runs automatically as part of the Pi bootup sequence and launches the startup program. Then, the startup program initializes and launches all of the programs needed for the mission, as well as starting a twelve-hour restart timer. The startup program is written in Bash due to Bash’s compatibility with the native Linux-based shell. The startup program launches the monitor program two minutes after the Pi’s bootup sequence completes. This allows time for all of the other programs to launch and begin functioning properly. After the two minutes are elapsed, the monitor program checks to make sure that all other programs are running. If a program has terminated or stopped producing data, the monitor program will initiate a soft system restart. The monitor program is written in Python. The startup program also launches the sensor program (immediately). The sensor program, written in Python, configures the sensor by writing to the sensor’s control registers and reading data from the sensor’s output registers. This data is collected by the Pi by the I2C protocol and is packaged into a timestamped JSON file no more than sixty times per minute. Because the largest possible data packet is approximately 450 bytes, the maximum data rate of the experiment is 0.5 kBps. The data output from the sensor can delineate by particulate matter diameter (<0.5μg, <1μg, <4μg, <10μg, >10μg) and also calculates particulate matter density in μg/m3. All of this data is very useful for validating the accuracy and reliability of the SPS30. Specifically, this gathered data will be analyzed by the team and compared to predicted results, testing results, prior mission results, and any other data figures relevant to the collected data. Depicted in Figure 6 is a screenshot of a JSON data packet assembled by the sensor program. The transfer program is a simple program designed to move the timestamped JSON files to the /tmp/experiment/ directory (folder) as required by the DETECTS ICD. All this program does is make the /tmp/experiment/ directory, as it is intentionally deleted by the system with every reboot, and it moves all JSON files to the /tmp/experiment/ directory to be handled by UAH’s program. The transfer program is written in Bash.
While onboard AR2B, the experiment will have to remain functional within the environment. As defined by the RFE and ICD, there are certain functional requirements alongside several environmental requirements that must be met in order to qualify as a sub experiment for AR2B. In order to meet the basic functional requirements laid out by the RFE and ICD, the experiment must be able to take measurements, organize data packets, and send data. This team chose to include several more requirements to better suit the mission and demonstrate the team’s focus on safety and reliability. These additional requirements include establishing an accurate particulate count, handling program errors, and resuming operation after a reboot. The latter two requirements were added in order to take into account unpredictable or unexpected errors that may occur during the mission. To be able to meet the environmental requirements, the experiment must survive the conditions that will be experienced while aboard AR2B. These environmental conditions include surviving extreme temperatures (as low as -20℃ and up to 90℃), surviving a vacuum, and surviving up to 4 gs of random vibration.
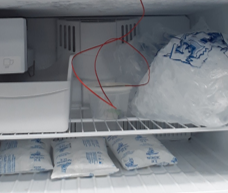
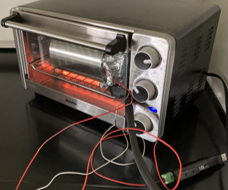
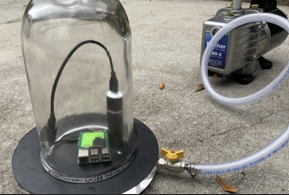
In order to meet the functional and environmental requirements required by the team and UAH, the team created a test plan for functional and environmental testing. The tests designed include the functional tests, which includes the Sensor, Transfer, and Recovery, as well as the environmental tests, which include the Vacuum, Thermal, and Vibration tests. For all of these tests, the safety of the team members and the experiment was considered to be the main priority. During testing, team members present wore proper personal protective equipment (PPE), had emergency equipment in the room, cleaned and inspected all equipment before use, and made sure they were operating in a clear and safe lab environment. Steps taken to ensure the safety of the experiment include using grounded wristbands and ground-fault circuit interrupter (GFCI) equipped outlets. In addition to the listed precautions, additional measures were taken for certain tests due to a unique situation posed by the test or testing environment. The first functional test, the Sensor test, was created to determine if the experiment can take measurements, organize data packets, send data, and establish an accurate particulate count. For the experiment to pass this test, it must accurately reflect an increase in particles when a particulate source is introduced. For this test, the experiment was placed in an enclosed container and was run for one hour to establish a baseline measurement. Then, a lit butane lighter was inserted into the container for 5 seconds. Following this, the testers removed the lighter and resealed the container. The test was successful as the experiment worked as expected, showing a 17,600% increase in particulates (μg/m3). The Transfer Test was the team’s second functional test, and it was made to determine if the experiment can organize data packets and send data. To pass this test, the experiment must accurately transfer JSON data packets from the /tmp/experiment/ directory to the UAH transfer program. This test was completed by simply powering on the experiment, and ensuring that the UAH program was receiving the packets via the program’s built-in data rate feature. The transfer program was successful in transferring the time-stamped files to the /tmp/experiment/ directory, and per the UAH transfer program, the experiment has a current maximum data rate of 0.5 kBps and an average of 0.3kBps. This test was run 25 times with zero failures. The final functional test was the Recovery Test, which determined if the experiment can handle program errors and resume operation after a reboot. To pass this test, the experiment must be able to restart after SPS30 power loss, disconnected GPIO wires, and halted programs. The test was run 50 times with the experiment rebooting successfully every time. The Thermal Tests, namely the cold and heat test, were completed in order to meet the requirements of surviving within the temperature extremes of -20℃ and 90℃. To pass these tests, the experiment had to be able to function and take measurements while experiencing temperatures up to 90℃ and as low as -20℃. This test was completed using a freezer cooled to -20℃ (pictured Figure 7) and a toaster oven provided by UAH (pictured Figure 8), which was heated to 90℃. First, each individual component of the experiment, the PCB, SPS30, and wires, were each tested at 90℃ for an hour and -20℃ for an hour. After testing the individual parts of the experiment, the fully assembled configuration was operated at 90℃ for one hour and -20℃ for one hour. During each environmental condition, a variation of the sensor test was completed to demonstrate the experiment’s ability to function at different temperatures. This variant of the sensor test was completed by inserting the experiment into a particulate containing canister. During the cold test, this variant of the sensor test was completed for 10 minutes in the middle of the cold test, creating a 0-25 minute cold test and a 35-60 minute cold test. The experiment worked as expected and the sensor was able to function successfully in both environments. The vacuum test was made to determine if the experiment could survive, take measurements, organize data packets, and send data in vacuum-like conditions. To pass the vacuum test, the experiment was required to be able to survive (UAH requirement) and operate (Team Requirement) within a vacuum for 30 minutes. Prior to testing, a vacuum chamber provided by UAH was cleaned, re-oiled, and inspected for defects. After this, the experiment was run inside the vacuum chamber for 30 minutes (pictured Figure 9). While re-pressurizing the chamber, we introduced particulates to further demonstrate the experiment’s ability to function in a vacuum. The experiment was able to survive and detect particulates while operating within a vacuum for 30 minutes and met all requirements set by the team and UAH; therefore, the experiment passed the vacuum test.
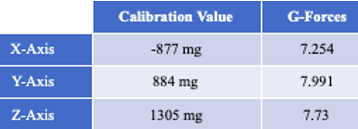
The random vibration test was designed to determine if the experiment could maintain structural integrity while experiencing up to 4g of random vibration (max g-forces shown in Table 3). The purpose of this test is to simulate rocket launch. To pass this test, the experiment must remain intact and operable after surviving these conditions. For this test, the payload and a UAH provided accelerometer was secured to a baseplate (experiment depicted in Figure 10) and vibrations were introduced for 15 minutes according to UAH recommended testing guidelines. Specifically, the experiment and accelerometer were mounted to a wooden board and placed on an egg crate foam dampener. Then, the board was hit at different angles with a rubber mallet into the egg crate foam dampener to generate the necessary g load without putting undue stress on the experiment. After testing, the experiment was inspected for any hanging or disheveled parts and the data collected afterwards was compared to the data collected prior to testing to determine success or failure. Ultimately, the experiment passed the vibration test as the experiment was able to survive and function accurately after the vibration test.
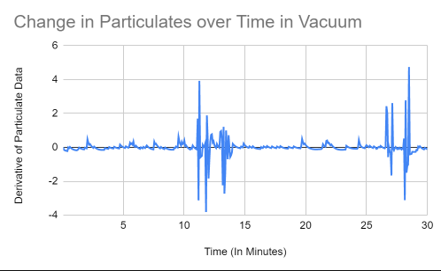
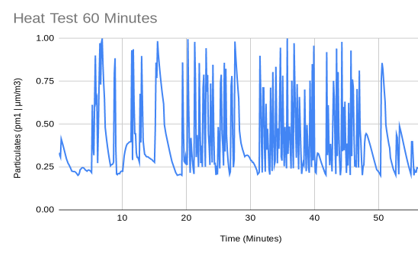
The team was careful to take a sequential and organized approach to gathering and analyzing data. After a test was conducted, all data packets gathered during the test were transferred to an analysis computer via a remote connection. Once the data was successfully transferred to the analysis computer, a Python program designed to extract relevant data was run on the collected data packets. Once the necessary data had been extracted, the data points were imported into a labeled spreadsheet. Once in the spreadsheet, that data was analyzed using a variety of statistical tools, formulas, and graphs. The team conducted many types of regression, created control charts, estimated confidence intervals, f-tests, and many other types of analyses. As suggested by UAH presentation guidelines, the team conducted a statistical analysis on data collected during the functional tests. For the recovery and transfer test, no new information could be gathered by analyzing the particulate data collected, as the manipulated variable for those tests was independent of all variables affecting the reliability of the SPS30 itself. For the Recovery test, no notable data could be gathered except that the triggered error to shutdown delay time is less than one second, and the reboot time is a maximum of 120 seconds. For the transfer test, the largest possible data packet was approximately 0.47 kilobytes, and at a set maximum rate of 1 data packet per second, the maximum possible data rate is 0.47 kBps based on the data from the transfer test. To determine the average data rate, the total size of 600 data packets was divided by the total time taken to transfer the packets, resulting in an average data rate of 0.312 kBps. For the sensor test, a baseline sample was taken for 1 hour. As the baseline particulate count was so small compared to the values collected after particulates were introduced (a ratio of 1:178), there was no need to conduct an analysis to see if there was a difference in particulates between the baseline and testing data. As opposed to the limited analysis conducted for the functional tests, the team decided to conduct a much deeper analysis of the data gathered during environmental tests that was required by UAH. For the environmental tests (vacuum, thermal, and vibration tests) UAH only required a basic analysis of the data collected. The suggested method for data analysis was to visually compare collected data to a baseline. This team decided to conduct deeper analysis to validate the functionality of our sensor in addition to comparing data to a baseline as recommended by UAH. For the thermal (heat and cold) tests as well as the vacuum tests, the same statistical process was used to analyze the data. This process was (in essence) to take the derivative of the particulate data and create a linear regression (a linear line of best fit) from this data. The purpose of taking the derivative of all of the particulate data was to determine if the rate of change of the data over time was increasing, decreasing, or remaining constant. When the graph of the thermal (heat and cold) tests were analyzed, the team discovered that the slope of the linear regression of the data was slightly negative for both tests (shown in Figure 12), indicating that the total number of particles had decreased during the test. However, this decrease was so small, that, when applied back to the original data set, it resulted in a decrease of approximately 6.733 ng/m3 (heat test) and 17.823 ng/m3 (cold test 0-25) and 12.909 ng/m3 (cold test 35-60). After determining this, the team realized that the decrease was so small that it could be considered an insignificant data point. Furthermore, the environment could not be fully controlled, due to the location of the heat test in a fume hood and unsealed oven, and the cold test in a partially sealed container and a standard freezer. As such, slight inconsistencies are to be expected and, due to the nature of the experiment, are irrelevant to the team’s objective. When the data from the vacuum test was analyzed, the team discovered that the slope of the linear regression of the data was exactly zero (shown in Figure 11). Using this statistical evidence, the team concluded that regardless of fluctuations, the amount of particulates within the vacuum chamber remained constant. This data supports the hypothesis of the team, who inferred that because the vacuum chamber is a sealed container with no particulate sources, the particulates count within the container will remain constant. This statistical analysis, in addition to the baseline, effectively demonstrated the experiments ability to survive, collect data, send data, and function accurately within a vacuum.
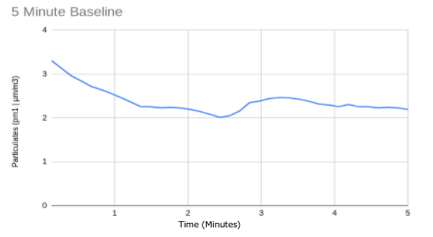
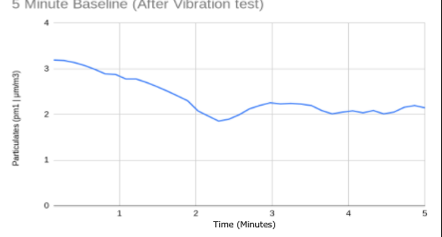
Finally for the vibration test, no particulate data was collected, as the experiment will not be operating in an environment that this test attempts to simulate, namely, the rocket launch. However, before and immediately after the vibration test (Figures 13 and 14), the experiment was powered on to verify that the sensor and all connections were working properly and establish baselines. From both baselines, 600 data packets were gathered and compared. Both baselines had their upper limits within ± 0.05 μg/m3 of each other, a lower limit within ± 0.1 μg/m3 of each other, and a mean of approximately 2.25 micrograms per cubic meter for both. In conclusion, all functional and environmental tests demonstrated that the experiment was able to meet all requirements set forth by the team and UAH, and generated accurate data packets in all environments and after all tests.
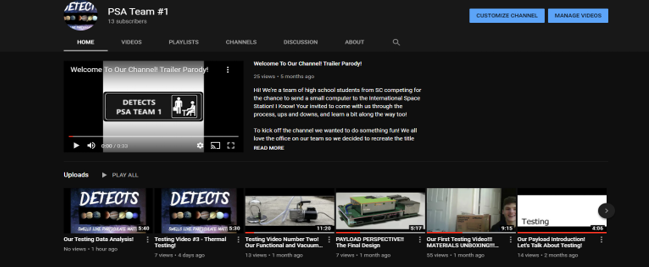
The team’s choice of social media platform for outreach was Youtube. Due to its unique characteristics as a platform, the team was able to present its STEM-focused platform in the most dynamic way possible. In contrast to posting in a photo-and-caption format, using a video-based platform allowed the team to be creative and have a multitude of topics for video content. Based on a certain week’s video topic, the team was able to post either discussion style, activity, or “vlog” type content to engage audiences as much as possible. To complete their video-centered content plan, the team decided to utilize Youtube as their platform, as it is one of the leading online video hosting websites. The DETECTS program outlines requirements and guidelines for creating specific content to be completed by individual teams. The team began video content with a trailer, targeted towards middle school and high school audiences. The trailer was created as a parody of a very popular television show called “The Office.” This parody was intended to be the first video viewers saw when visiting the channel page, in order to set a fun and unique tone that showcases the engaging and interactive dynamics for the entire channel. After the parody introduction video, the team began creating video content showcasing DETECTS specific content and our science or experiment objective. These videos were posted as a continuation of the team’s introduction video to cover the basics of who is on the team, what the team is doing, and the purpose for the channel. These videos were shortly followed by the team’s outreach specific videos. The team’s outreach videos cover the basics of outreach and further explain the team’s specific goals for the channel and were started by the first two activity video posts. The first activity video showcased a model solar system built by the team. This video was meant to create engagement for younger audiences and highlight the teams’ experiment’s hopeful destination, space. The following video covered the DETECTS competition and basic information covering the AR2B mission. The next three videos posted to the channel covered the objective, the experiment, and an introduction to the testing process. The team had then reached a point in the competition where they began the testing process and a bulk of the live footage, featuring a series of videos titled the Testing Saga. The first video in the saga covered the materials unboxing, the second the team’s Functional and Vacuum Testing, the third being the thermal testing, and finally the fourth being the team’s vibration testing. The team posted our Data Analysis video after the Testing Saga as a closing to the testing phase and allowing the viewers to get a look at the experiment’s testing results and physical data. Our final additions to our channel were the project summary video, where the team covered the final project, the pros and cons video where they discussed what they learned from their time competing in DETECTS, and our preparation for our final presentation video where we took our viewers through the process of completing the final steps of the project. Our team’s last upload was a thank-you video where each team member thanked the channel’s viewers and discussed what will happen next.
The team’s main objective with Outreach over the course of the competition was to introduce and engage students into the world of STEM. The team wanted their channel to serve as inspiration to its viewers, and encourage them to seek out opportunities through their own schools or communities. The team also assigned themselves the goal of hopefully giving their viewers something to take away from the videos in terms of what it means to work on a team, applying what they learn in their classrooms to real-world simulating activities and competitions in a fun manner. The team performed two activities on their outreach platform. The first was our building-a-model-solar-system activity. Due to the team’s science objective being very specific, particulate matter, they wanted to find a broader but still relevant topic to base their activity around. They chose to find something to do with the destination of their experiment. A model solar system allowed the viewers to draw a connection between what the team is working on now with the experiment and the scale of the end goal. This activity was able to demonstrate the place the ISS calls home, our solar system, in a way that also included fun facts surrounding all eight planets. The second activity was in the form of a demonstration. In one of the testing videos, we performed our vacuum tests. Since the experiment is solid, there wasn’t much of a visual reaction when it was placed in a vacuum, and therefore it was harder for the younger viewers to understand what a vacuum is. The team performed different tests using miscellaneous objects from their school and filmed what happened to the objects as they were put into and then taken out of a vacuum. This demonstration had the purpose of developing a better understanding of not only the testing process but also the climate of the solar system, where the experiment may eventually end up on the ISS.
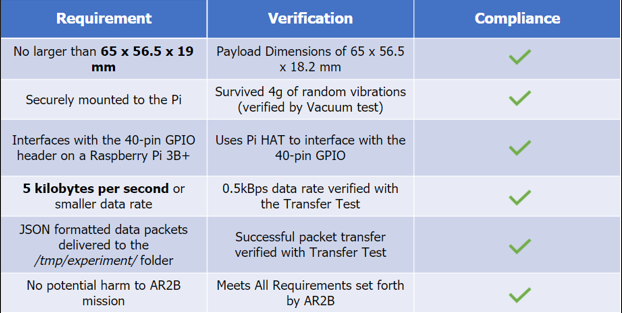
During the first half of this project, “Smells Like Particulate Matter'' established as a team and selected three potential science objectives, “Material Reflectivity,” “Commercial Grade Contaminants Comparison,” and “Fiber Optic Radioactivity.” After conducting a trade study, the objective “Commercial Grade Contaminants Comparison” was selected due to its high scoring in team interest, measurement method, and the likelihood of a successful experiment. After choosing this science objective, the Sensirion SPS30 sensor was chosen, a custom Raspberry Pi HAT was modeled, and the experiment was programmed to ensure proper functionality. Additionally, “Smells Like Particulate Matter” conducted functional tests in the first semester to ensure functionality of the Raspberry Pi HAT configuration and the program structure. Going into the second (testing-focused) semester, the team developed plans to ensure that the configuration would be tested up to the requirements specified by UAH and the team. As shown in Table 4, The experiment meets all ICD requirements. “Smells Like Particulate Matter” was tasked with ensuring that the experiment configuration would properly function in all conditions. To ensure all environmental variables were accounted for, the experiment withstood thermal, vibration, and vacuum tests designed to determine its limits. Some of the equipment used in these tests include a toaster oven, a vacuum chamber, a freezer, a vibrating baseplate, and an assortment of sensing equipment. The experiment passed all of these tests with no error, leading the team to conclude that, based on the requirements, the configuration is up to UAH standards. Overall, it is the opinion of this team that the experiment could validate an important piece of equipment through its proposed evaluation in spaceflight. In addition, the validation of the SPS30 would help facilitate the integration of cost effective replacements for existing equipment on platforms such as the International Space Station and its ANITA air quality monitoring system.
Table 4: ICD Compliance Table