Features Channel Timeline
The Channels view has two modes: Timeline (single channel history) and Compare (multi-channel overlay). Switch between them using the tabs at the top.
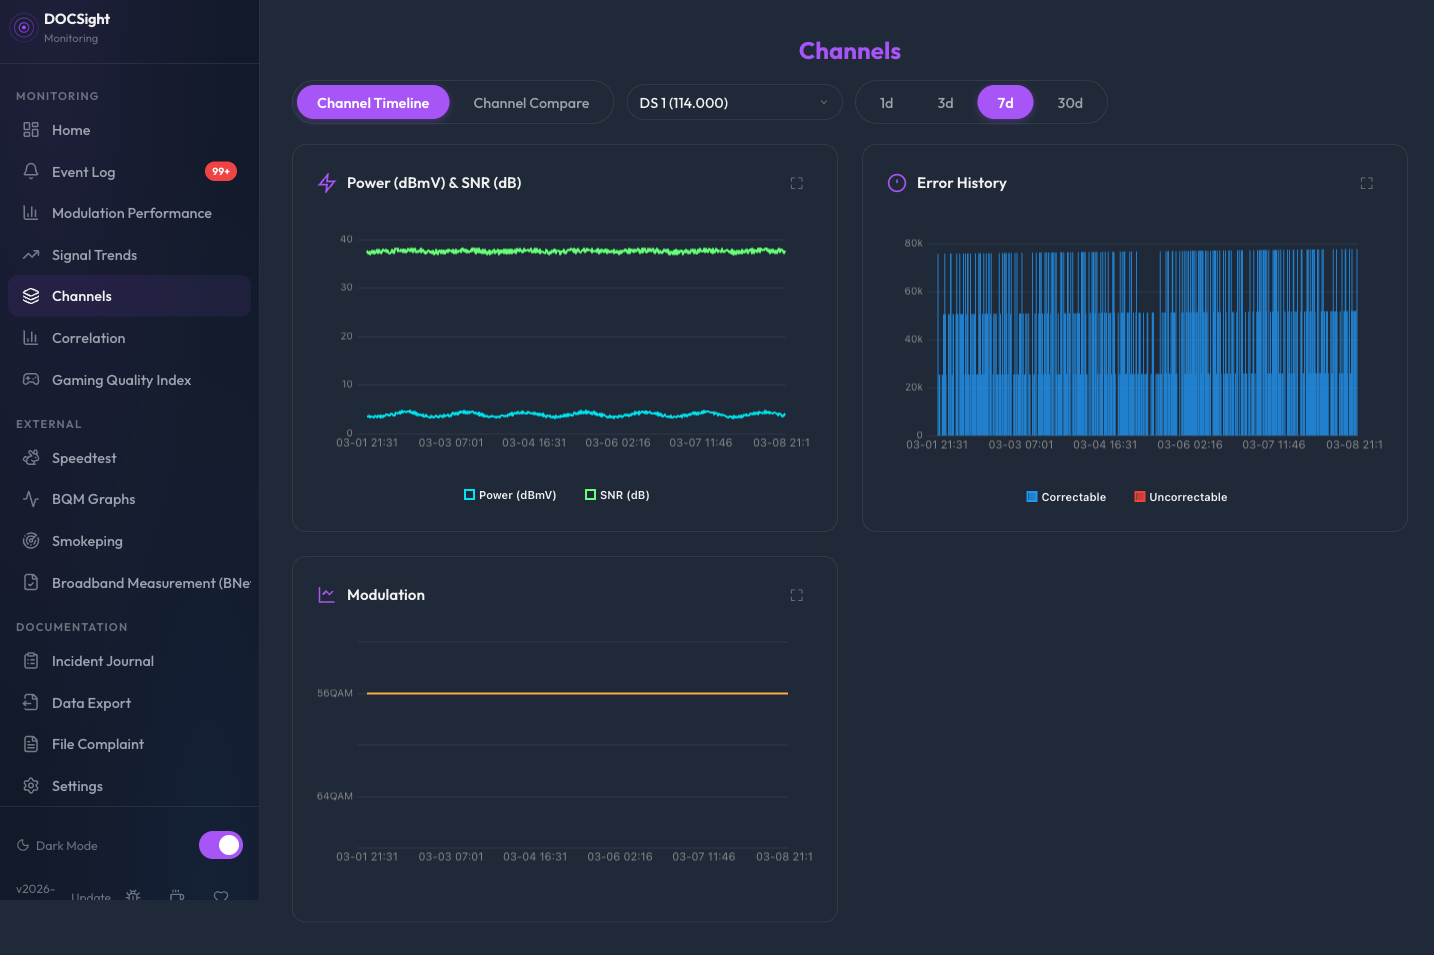
Track individual channel metrics over time. Select any downstream or upstream channel to see its historical performance.
For DS channels, you get:
- Power & SNR chart (dual-axis line chart)
- Error History (correctable + uncorrectable errors as bar chart)
- Modulation badge showing current modulation (e.g. 256QAM)
For US channels, you get:
- Power chart with VFKD reference zones
- Modulation timeline showing modulation changes over time
US channels don't report error counters on the Fritz!Box, so no error chart is shown.
When a channel's modulation changes, the timeline shows each change as a color-coded segment:
| Color | Meaning |
|---|---|
| 🟢 Green | Upgrade (e.g. 16QAM -> 64QAM) |
| 🔴 Red | Downgrade (e.g. 64QAM -> 16QAM) |
| 🔵 Cyan | Stable / initial value |
This makes it easy to spot when your ISP's CMTS is struggling with your return path.
Compare channels side by side with color-coded overlay charts. Useful for spotting patterns across channels (e.g. all channels dropping power at the same time) or identifying a single problematic channel.
- Select direction -- Choose Downstream or Upstream using the toggle. Only channels of the selected direction are available.
-
Add channels -- Either:
- Use the dropdown to select individual channels (up to 6), then click Add
- Click All Downstream / All Upstream to load every channel at once
- Selected channels appear as colored chips below the controls. When using the all-channel preset, a single summary chip is shown (e.g. "All Downstream (32)"). Click the X to clear.
- Clear -- Reset the selection and charts.
- Choose time range -- 1d, 3d, 7d (default), or 30d.
The All Downstream and All Upstream buttons load every channel of the selected direction in one click. This is useful for getting a full picture of your modem's signal health across all bonded channels.
When many channels are shown, per-point markers are automatically hidden to keep the charts readable. Colors are generated using golden-angle spacing to maximize visual separation between channels.
Downstream channels show:
- Power -- One line per channel with DOCSIS reference zones
- SNR -- One line per channel (dashed) with reference zones
- Errors -- Solid lines for uncorrectable errors, dashed for correctable (per channel)
- Modulation -- Stepped lines showing QAM level changes
Upstream channels show:
- Power -- One line per channel with reference zones
- Modulation -- Stepped lines showing QAM level changes
When switching between Downstream and Upstream, your channel selections are preserved per direction. Selecting three DS channels, switching to US, adding two US channels, then switching back to DS restores your original three DS channels. This avoids having to re-select channels every time you toggle direction.
- Manual selection: up to 6 channels via the dropdown
- All-channel presets: up to 64 channels (API limit)
- Error charts use lines (not bars) in Compare mode for readability
Both Timeline and Compare views store their state in the URL hash, so you can bookmark or share a specific view. The URL updates automatically as you interact with the controls.
#channels?mode=timeline&dir=ds&channel=42&days=7
| Parameter | Values | Default |
|---|---|---|
mode |
timeline, compare
|
timeline |
dir |
ds, us
|
- |
channel |
Channel number | - |
days |
1, 3, 7, 30
|
7 |
#channels?mode=compare&dir=ds&days=7&channels=1,2,3
#channels?mode=compare&dir=ds&days=7&preset=all
| Parameter | Values | Default |
|---|---|---|
channels |
Comma-separated IDs | - |
preset |
all |
- |
days |
1, 3, 7, 30
|
7 |
Opening #channels without parameters resets all selections to defaults.
The view shows context-specific messages instead of blank areas:
| Situation | Message |
|---|---|
| Timeline, no channel selected | "Select a channel above to view its signal history." |
| Timeline, no data for range | "No channel history available for the selected period." |
| Compare, no channels added | "Select channels to compare" |
| Compare, no data for selection | "No data for the selected channels in this time range." |
Both modes share the same time range options:
- 1 Day -- detailed intraday view
- 3 Days -- short-term trends
- 7 Days -- weekly overview (default)
- 30 Days -- monthly perspective
| Endpoint | Description |
|---|---|
GET /api/channels |
List all current DS and US channels |
GET /api/channel-history?channel_id=X&direction=ds|us&days=7 |
Per-channel time series data |
GET /api/channel-compare?channels=1,2,3&direction=ds|us&days=7 |
Multi-channel time series for overlay comparison (max 64) |
Timeline added in v2026-02-13.2. Compare added in v2026-02-19.1. All-channel presets added in v2026-03-12. URL persistence, empty states, and direction memory added in v2026-03-13.