![]()
The final objective is to setup automated tests to support end-to-end testing of the deployed #30DaysOfSWA website at https://aka.ms/30DaysOfPWA
The initial objective is to document the usage of Playwright as the testing framework, following the Getting Started tutorial as a quickstart, then refining the established test structure and scripts to meet requirements.
Note that the #30DaysOfSWA site is built and deployed from this source repository. In a real-world application, we would be setting up the tests in the same repo to automate testing on every push or commit to the source.
However, this* repo is being used as a tutorial to explore Playwright capabilities - so writing it as a standalone project that tests only against the deployed SWA website.
There are three options:
- Using VS Code extension for default scaffold and config from IDE
- Using
npm initfor default scaffold and config at commandline - Manually for more granular control over process.
For now, I'm taking the second route.
npm init playwright@latest
The command should kickstart the process by asking you to configure your preferences for programming language, testing folder location, and GitHub Actions integration. Here is what that looks like (output truncated for clarity)
Getting started with writing end-to-end tests with Playwright:
Initializing project in '.'
✔ Do you want to use TypeScript or JavaScript? · JavaScript
✔ Where to put your end-to-end tests? · tests
✔ Add a GitHub Actions workflow? (y/N) · true

Initializing NPM project (npm init -y)
Wrote to <pwd>/package.json:
...
...
Chromium 102.0.5005.40 (playwright build v1005) downloaded to <dirname>
Firefox 99.0.1 (playwright build v1323) downloaded to  <dirname>
Webkit 15.4 (playwright build v1641) downloaded to  <dirname>
...
...
Writing playwright.config.js.
Writing .github/workflows/playwright.yml.
Writing tests/example.spec.js.
Writing package.json.
✔ Success! Created a Playwright Test project at <pwd>
The installation then ends with some recommendations:
Inside that directory, you can run several commands:

  npx playwright test
    Runs the end-to-end tests.

  npx playwright test --project=chromium
    Runs the tests only on Desktop Chrome.

  npx playwright test example.spec.js
    Runs the tests in the specific file.

  npx playwright test --debug
    Runs the tests in debug mode.

We suggest that you begin by typing:

    npx playwright test

And check out the following files:
  - ./example.spec.js - Example end-to-end test
  - ./playwright.config.js - Playwright Test configuration

Visit https://playwright.dev/docs/intro for more information. ✨

Happy hacking! 🎭
-
It installs the Playwright commandline tools in your local development environment. Let's validate by checking the installed version.
$npx playwright --version Version 1.22.1 -
It downloads and installs the three core browsers required for cross-platform testing: Chromium, Firefox and WebKit. Check the output to see which versions were installed. You can always use the manual option to customize the browser installation
-
It sets up the basic configuration files, dependencies and scripts required to run your end-to-end tests. Here's what that looks like (output cleaned up and annotated for clarity)
$ ls
.git/
.github/
    workflows/
        playwright.yml // Playwright actions
.gitignore
LICENSE
node_modules/
playwright.config.js  // Playwright config
README.md
package-lock.json
tests
    example.spec.ts    // Playwright tests
package.json
Let's take the installation log's advice and run the default Playwright Test Runner on the default test script.
$npx playwright test
Here's what we see:
$ npx playwright test

Running 75 tests using 3 workers
[63/75] [webkit] › example.spec.js:227:3 › Editing › shoul
  Slow test file: [webkit] › example.spec.js (41s)
  Slow test file: [firefox] › example.spec.js (30s)
  Slow test file: [chromium] › example.spec.js (29s)
  Consider splitting slow test files to speed up parallel execution

  75 passed (41s)

To open last HTML report run:

  npx playwright show-report
What did this do? It ran the default (25) tests in the example.spec.js file on the (3) target browsers identified in the "projects" section of the playwright.config.js file. Currently the test runner uses three workers - however you can control parallelism and sharding for efficiency.
The default test configuration and spec files are heavily annotated - helping you understand exactly what the test achieves, and how to configure the test run.
By default, tests are run against this TODO MVC demo app.
 In the later "Customize Tests" section, we'll take our first steps in customizing the default script to run against the #30DaysOfSWA site instead, and use the process to understand more about the testing process.
You may have noticed that the execution of the test run ended with the following message:
To open last HTML report run:

  npx playwright show-report
This should launch the default browser open to http://127.0.0.1:9323/ - showing an HTML-based report as shown below.

We can immediately note a few things:
- The report provides a summary of tests status (top)
- It breaks down status for each test by browser, duration (performance)
- It allows to dive into a given test for details.
For example, clicking on the first test takes us to this screen which breaks down the status and duration of each test action within that test.

That's right - the default scaffold sets up the .github/workflow/playwright.yml file for you. Let's take a peek inside:
name: Playwright Tests
on:
  push:
    branches: [ main, master ]
  pull_request:
    branches: [ main, master ]
jobs:
  test:
    timeout-minutes: 60
    runs-on: ubuntu-latest
    steps:
    - uses: actions/checkout@v2
    - uses: actions/setup-node@v2
      with:
        node-version: '14.x'
    - name: Install dependencies
      run: npm ci
    - name: Install Playwright Browsers
      run: npx playwright install --with-deps
    - name: Run Playwright tests
      run: npx playwright test
    - uses: actions/upload-artifact@v2
      if: always()
      with:
        name: playwright-report
        path: playwright-report/
        retention-days: 30
We can see that this sets up a GitHub Action that installs dependencies and required browsers, then runs the test - and uploads the report as an artifact to your GitHub repo that is retained for 30 days.
Let's see this in action by committing the file. If you check the Actions tab on your GitHub repo, you should see the workflow triggered by the most recent commit. When it completes you should see something like this:

Note: this may take a non-trivial amount of time on the initial tests given the number of browsers and tests run. Later on, we can customize the configuration to be more specific to our needs.
Notice the Artifacts section - if you click on the playwright-report it should download a trace file (playwright-report.zip) to your local development devices. Want to see what this contains?
Download and unzip it - it should contain a simple HTML file that you can open in a local browser, to see the same kind of report we saw earlier.
Move the existing script to examples.spec.js.orig then create a new examples.spec.js - and let's copy over the First Test from the Playwright docs.
Customize it to navigate to your testing site (in my case https://www.azurestaticwebapps.dev/) and test using a valid selector. In my case, since both #30DaysOfSWA and Playwright.dev use the Docusaurus site generator, I can reuse the same test and just match it up to my title of #30DaysOfSWA
// @ts-check
const { test, expect } = require('@playwright/test');

test('basic test', async ({ page }) => {
  await page.goto('// @ts-check
const { test, expect } = require('@playwright/test');

test('basic test', async ({ page }) => {
  await page.goto('https://www.azurestaticwebapps.dev/');
  const title = page.locator('.navbar__inner .navbar__title');
  await expect(title).toHaveText('#30DaysOfSWA');
  const title = page.locator('.navbar__inner .navbar__title');
  await expect(title).toHaveText('#30DaysOfSWA');
});
Let's run it locally! But wait, we'll make one tiny tweak.
We'll go into the playwright.config.js file and change the trace property value from on-first-retry to on. What this does is turn on Trace Viewer during the test run, giving us an incredibly more detailed trace log.
Just like before, let's run the test - and then look at the report.
npx playwright test
npx playwright show-report
Runs just like before - but wait, the report looks a bit different does it not?
The HTML Report
Note that now we have just a single test running on all three browsers, and we get the same status and timing information.

Dive into one of those tests, and now we see something different - a trace screenshot that seems to have more detail! Let's click on it!

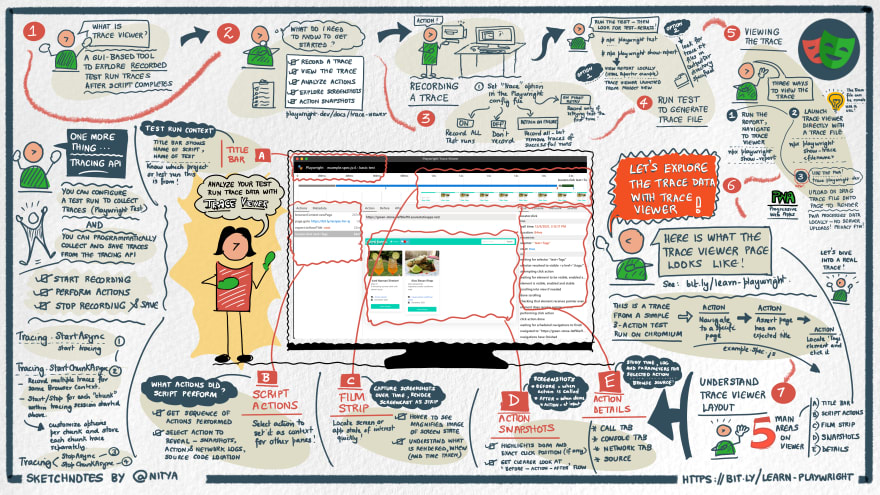
Behold the power of Trace Viewer. This tool provides detailed information for profiling the performance, seeing screenshots and snapshots (before/after test action) to help you debug and audit your app better.

Want to learn more about Trace Viewer? Read this article on dev.to and here's a handy visual guide. You can find a hi-res downloadable version here that walks you through the many features.
CONGRATULATIONS!
You just setup a Playwright testing harness for testing your deployed Static Web App. Commit these changes to see the trace files show up in your artifacts.
EXERCISE
Your turn. Study the original test spec and see if you can understand how different test actions are created. Try adding a new test to your existing script and see how that works.
Feeling motivated? Try using codegen to have Playwright auto-generate tests for you based simply on your walkthrough of the default user experience on your website.
Now, we can start playing with the scripts to customize our test workflows more.