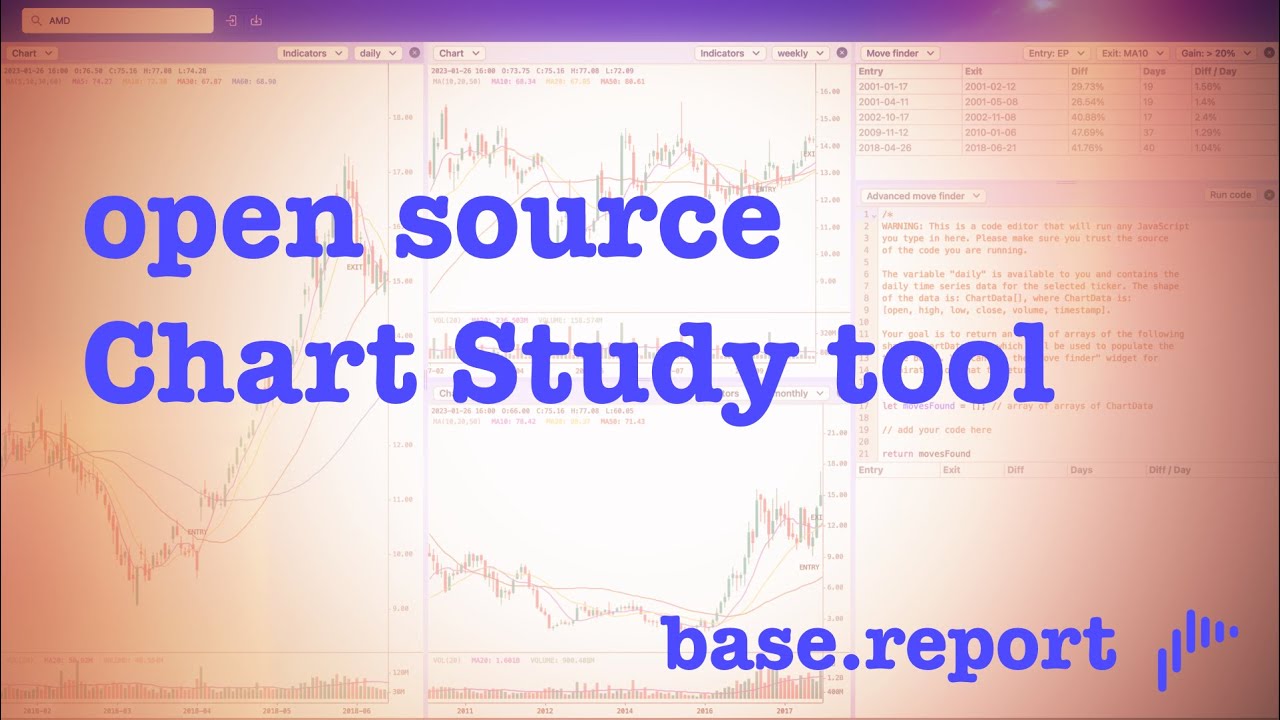
The Chart Study tool, by base.report, is a web-based application for analyzing stock charts.
Warning: It is currently in alpha stage and may contain bugs or unfinished features.
- A frame that starts with a single pane and can be split to the right or to the bottom.
- Each pane can hold a widget, including a stock chart, move finder, and advanced mover finder (with embedded code editor).
- Customization options to personalize the user experience.

For a quick start guide on how to use the tool, please watch the following video tutorial.
Financial Modeling Prep is used as the data provider. You can obtain an API key from their website.
Following are instructions for installing the Chart Study tool locally and on Vercel.
Create a .env file and add the following content. You need to fill in SECRET_FMP_API_KEY value with your own API key.
SECRET_FMP_API_URL=https://financialmodelingprep.com/api
SECRET_FMP_API_KEY=
pnpm install
pnpm run dev

# or start the server and open the app in a new browser tab
pnpm run dev -- --open- Before setting it up on Vercel. Please note that the website will become accessible by anyone by default. If you want to protect the link, please visit: https://vercel.com/docs/concepts/deployments/deployment-protection.
- Fork this repo.
- Add your forked repo as a project on Vercel. You should be able to import the project using the default settings provided by Vercel. Please visit https://vercel.com/docs/concepts/projects/overview for more details.
- Set the environment variables (the same ones from above under Local). Please visit https://vercel.com/docs/concepts/projects/environment-variables for more details
We welcome feedback and bug reports. Please submit an issue or pull request on GitHub.
We welcome contributions to the Chart Study tool. Please submit pull requests and issues on GitHub. As the project is currently in alpha stage, there is no set standards yet except for semantic commit messages.
Chart Study tool is released under the MIT license. See the LICENSE file for more information.