
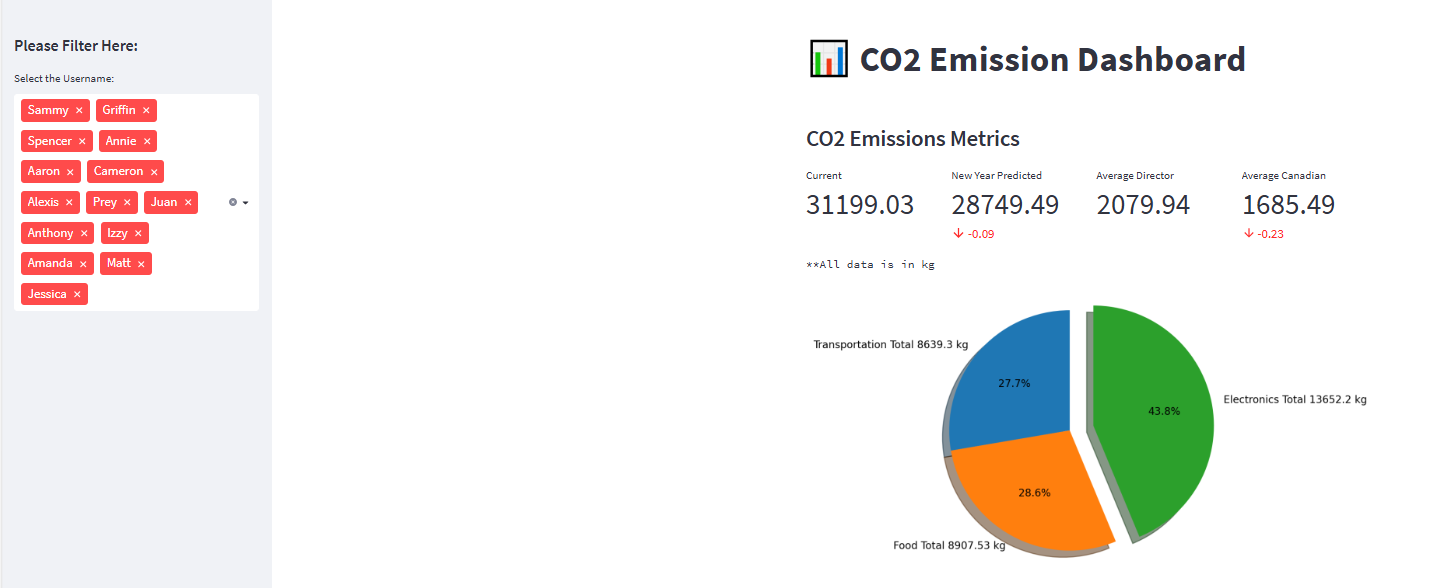
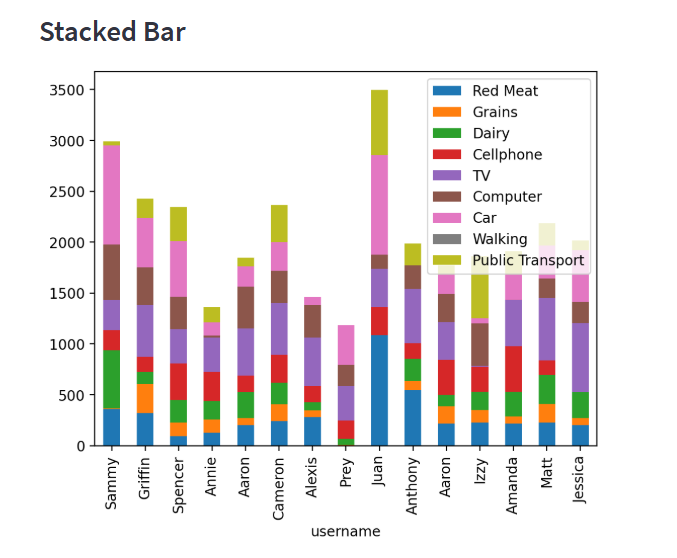
We were inspired to design a dashbaord that allows a clear graphical representation of carbonfootprint data by our users. We were tasked to visulize data from original .txt file into categorized .json files for different carbon emission metrics that allows updates and provide useful information to the environmental managers. 🌎🌲📊♻️🌱
| Tech |
|---|
- Clone the repo
streamlit run webapp.py/to start the webapp on localhost
- Andy Huang -
- Aaqil Murji -
- Marcus Tuen Muk -