During some recent work to discover what a sql server box was actually doing we stumbled across the wonderful command of typeperf (https://docs.microsoft.com/en-us/windows-server/administration/windows-commands/typeperf). This allowed us to generate csv data about every element of server performance which interested us.
The issue with this data is... well its quite hard to understand in Excel and we didnt have any fancy tools at hand to crunch through it so enter this project
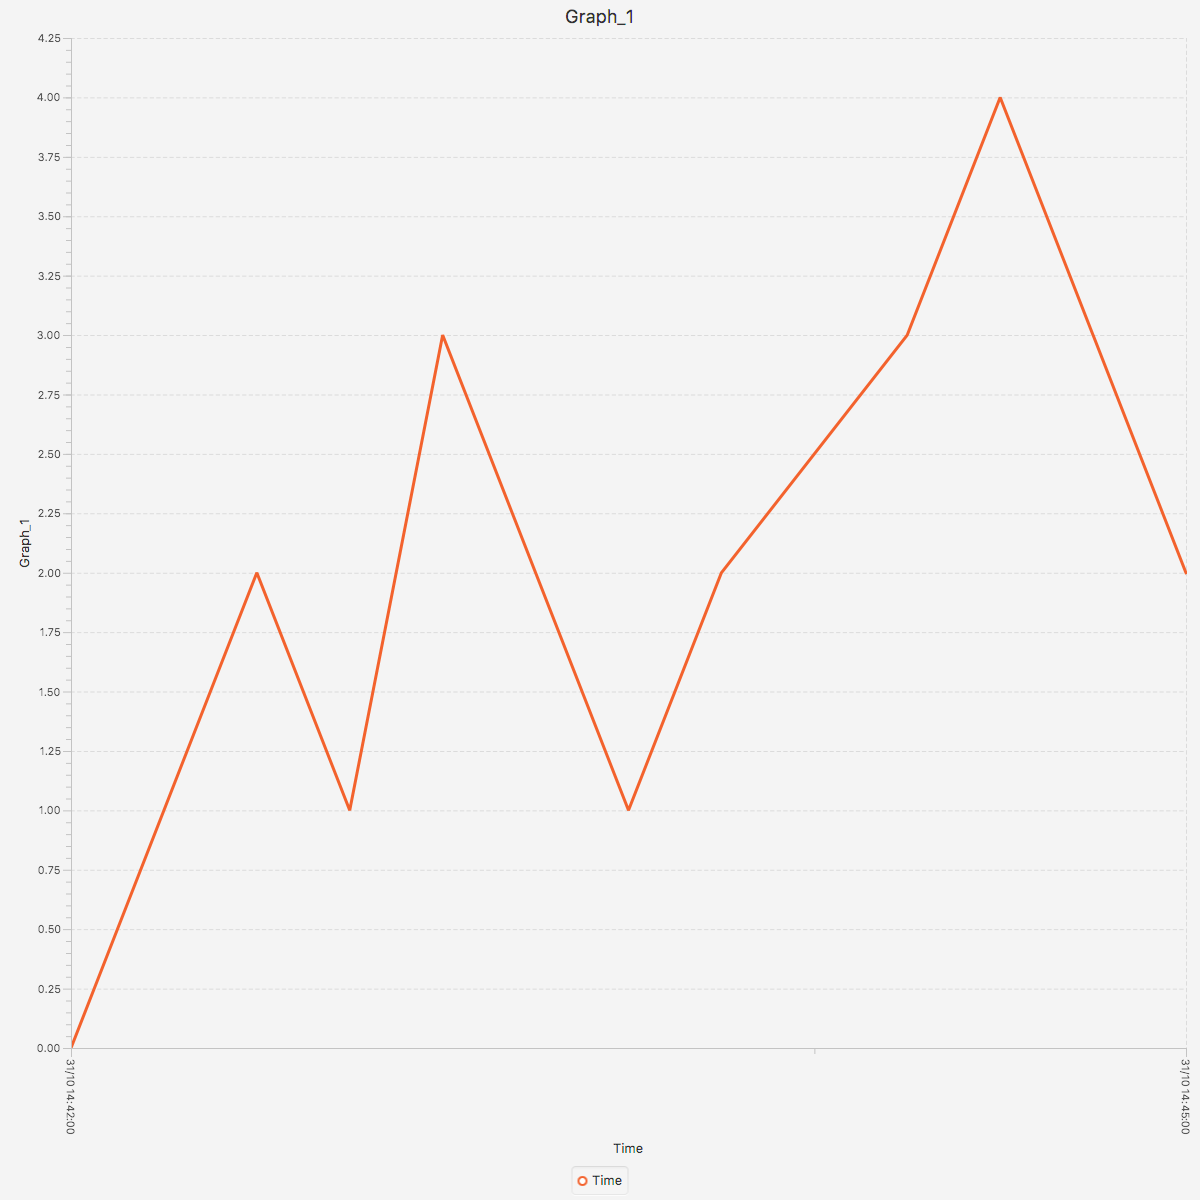
This code iterates through each dataset which has been output by typeperf and generates a graph to allow for a quick overview of what the metrics are showing.
It is likely you will have some form of server monitoring already in place to do this, if so this project is not for you!
Once the command runs the output is returned in the images folder. An example of the output is:
This project requires:
- Java 8
To run the example first we compile it using the command: ./gradlew clean build
To Execute the analysis run: java -jar build/libs/typeperf-analysis-service-0.0.1-SNAPSHOT.jar --sourceFile=./example-input-data/one-chart-example.csv
In no real order
- Addition of date / time filters to allow graphs to 'zoom in'
- Externalisation of graph styles
- Ability to change graph sizes
- Additional project to also kick off the typeperf command and analyse disk performance metrics
