Members - Akash Chawla, Philip Lo, Kishan Segu
Music has become part of many people’s lifestyles over time. It is a form of both personal expression and a kind of social interaction. Music consumption has increased tremendously over the past few years, and a number of companies such as Spotify, Gaana.com, Saavn, Pandora etc. have emerged providing streaming services. With the increasing availability of these streaming services and Bluetooth headsets, we have started to spend more time finding and adding songs to our playlists. By recommending users the music they like, companies are able to lure more customers and thus generate more revenue. With this change in the industry, music recommendations becomes increasingly important for customers in order to lure them into their streaming service. In this notebook, we will analyze and explore the Million Song Dataset, and find relationships between various features. Ultimately, we will also look into recommender systems, and how they're personalized for different individuals based on past history, or finding similar users in such a way that they like similar music.
(
The dataset we are using is the Million song dataset, which is a freely-available collection of audio features and metadata for a million contemporary popular music tracks. The dataset was taken from:
https://labrosa.ee.columbia.edu/millionsong/
Since this dataset is approximately 280GB in size, we'll be working with a subset of data in order to conduct our analysis.
- Numpy is imported since pandas relies on numpy to function
- Pandas is imported because of its ease of use. In this project we don't have any SQL files nor do we need to perform any SQL database related commands. In the case we do need SQL, pandas also supports that thus it's the best option for us
- Matplotlib is imported for graphing. It's heavily used in the data exploration section to get some visualization of the data. The %matplotlib inline command tells matplotlib to present graphs in order with the code in the cells
- Seaborn is used in the same manner as matplotlib but for more advanced visualization such as heatmaps
- Sklearn is imported for use in the ML section of this tutorial. The KMeans library was specifically imported to partition our data into clusters based on the features we choose
Furthermore, we would recommend using Jupyter Notebook for this tutorial since Python is already included, and importing all the necessary libraries is very easy.
The Million Songs Dataset we have is a csv file so we read it in with pandas. The datafile is relatively large so we will look at the first 20 rows rather than the default first 5 given by the head() function. Taking an initial look at the data file we see that there are some immediate issues with the dataset. There is an unnamed column with entries that correspond to the index of each row. There is also some missing data in artist.playmeid with with multiple entries having an id of -1. In the year column, there are multiple rows with entries of 0 all of which are missing data. The songs are identified by song.id rather than song name.
Here's a link where you can go to further understand the dataset, and how different fields are calculated:
https://labrosa.ee.columbia.edu/millionsong/pages/field-list
Cleaning up the dataset is very important prior to any analysis. We know that the unnamed column corresponds to indexing so we can drop that column, then check for any columns that have all data missing. We do this by writing a function that iterates through each row of each column and checks for repeating values.
For our dataset, both energy and danceability have missing values so we'll drop them from our dataset. Additionally we do some further processing on our dataset for better readability.
Next, we do some Exploratory Data Analysis/Visualization, the plots and explanation of which you can find in our notebook.
Visualizing helped us further understand our dataset, and also learn about some strong correlations between the features.
Our dataset has 19 fields, and by looking at them, we don't know if all of them have strong/any correlations, and whether they would be useful when we model our system. Just because we have so many features, it doesn't mean that we have to use all of them for our model. Selecting the most important features, and filtering out the unnecessary ones reduces overfitting, and also enables our model to train faster. Additonally, it makes our model less complex and easier to interpret.
Random Forests, which is an ensemble of decision trees, helps us extract the most important features. Features are chosen by how well they partition the dataset into pure subsets. Features that are higher up in tree have the highest score, and are higher up in the tree. Another important aspect of this algorithm is its randomness. When creating a decision split, the algorithm looks at a random subset of possible features.
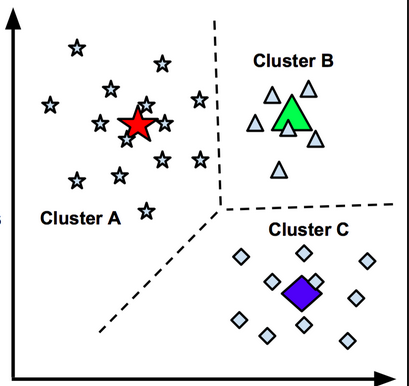
Once we have identified features that are strongly correlated such as artist hotness (popularity) and song hotness, the next step would be design a model that could separate the dataset into several clusters (groups). Our goal of using clustering is to organise a collection of patterns into several clusters based on similarity. The points within one cluster are more similar to one another than to every other point from the remaining clusters. We used the K-Means algorithm to cluster our dataset based on artist and song hotness.
Recommender Systems can be broken down into 3 types:
Popularity-based: This approach is very naive and would only recommend songs based on how popular it is. The disadvantage of this approach would be that it won’t be personalised and would be the same for each user. However, once we build a personalised recommender system, we would be able to compare our personalised recommender system with a popularity-based recommender system.
Collaborative-Filtering: This is a personalised model, and the systems use the actions of users to recommend other items. There are two types of Collaborative-based systems: user-based or item-based.

- User based model uses the patterns of similar users to recommend a product (users like me also looked at these other items). Assuming that similar people have similar taste, if we can find a way to find similarity between different users, and if two users are close in similarity, we can recommend them the same songs. Our clustering model can help us find similar users that we can use for this model.

- Item based model is based on the similarity between items calculated using people's ratings of those items. For example: The model would look for items that are similar to the songs the user has already listened to, and then recommend songs similar to that song. We could look at the songs the user has rated, and then compute the similarity to various songs, and recommend the most similar songs.
For modeling an item-item recommender system, we wanted to use Graphlab. However, we ran into some trouble installing it, but here's a link that uses Item-item similarity in graphlab to recommend songs:
https://mouaad.aallam.com/data-mining-recommender-systems/
A success would be the system recommending a list of similar songs. Ideally, we would like to recommend a song to a user using a mixture of content-based, and collaborative filtering system. This would be ideal since we’d be able to recommend a large amount of songs to a particular user, based on both his/her past history, and also recommend songs based on what other similar users have listened to. Based on how our model performs on the collaborative-filtering approach, we’ll decide if we want to add the content-based filtering as well. One drawback of using a collaborative-filtering approach is what many call the “Cold Start” problem. If the system hasn’t gathered any information about a particular user, it won’t be able to personalise content for that user. One way to resolve this problem is to force the user to leave a rating when they’re done listening to a particular song.
Our loss function is the difference in the song characteristics of the previous song and the selected song. We need the songs to be similar in order for the music to flow smoothly. If the songs don’t share things like tempo or key, the shift might prove jarring for the listener. Our loss function attempts to solve this problem by minimizing the song difference. This loss function is evaluated by comparing the numerical values of each characteristic of the songs. This value is then multiplied by some weight value depending on how important it is to the algorithm. The sum of these values lead to a calculation of difference between the two songs.
Loss = Sum(| Original song characteristic - Selected song characteristic| * Weight)
This project has allowed us to understand the inner-workings behind a recommender system, and how companies like Netflix, Amazon, Spotify, Pandora use recommender systems to give their customers the best possible experience. However, creating a robust recommender system is no easy task. There are a lot of variables that need to be taken into account, and a lot of different appraoches to create recommendations. For our project, here are some things we did:
First, we cleaned up our dataset, and followed it with some visualisation to understand it better. Once we felt comfortable with the dataset, we performed EDA, and found strong correlations for some features of our dataset. Through Random Forest Regressor, we were able to identify the most important features of the dataset. We also used K Means Clustering Algorithm to group our dataset into several clusters. Songs in the same cluster are assumed to be similar, and can be used in the recommendation process. Additionally, we used Linear Regression and Decision Tree Regressor to predict some of the features given a single feature. Additionally, we were able to determine features of a song that can affect its success such as artist popularity, tempo, loudness, duration etc. Overall, I feel that we illustrated critical trends in predicting a song for a user. Furthermore, we discussed the 3 types of recommender systems: Popularity, Content-Based, and Collaborative. We learned about advantages and drawbacks of using these models.
This project has allowed us to delve deep into Recommender systems, and also understand the complexity behind it. We also learned how to work with big datasets, and how feature selection is important to reduce complexity, and increase robustness. For future work, we would like to create a user-item cooccurence matrix to generate recommendations, and compare our results with a Content-Based and popularity model.