Note
Special Thanks to @masterwishx for creating this awesome dashboard, please leave credits to him, as I've only adapted this board to work with Prometheus instead of InfluxDBv2! Here is the Original Repository: https://github.com/masterwishx/Speedtest-Tracker-v2-InfluxDBv2
A dashboard to display data exported by Speedtest Tracker. Avalible Now at Grafana Dashboard 17808 (https://grafana.com/grafana/dashboards/24608-speedtest-tracker)
This dashboard shows data collected by Speedtest Tracker https://github.com/alexjustesen/speedtest-tracker and scraped by Prometheus.


- 25.12.2025
- Initial Version, converted from InfluxDB to Prometheus
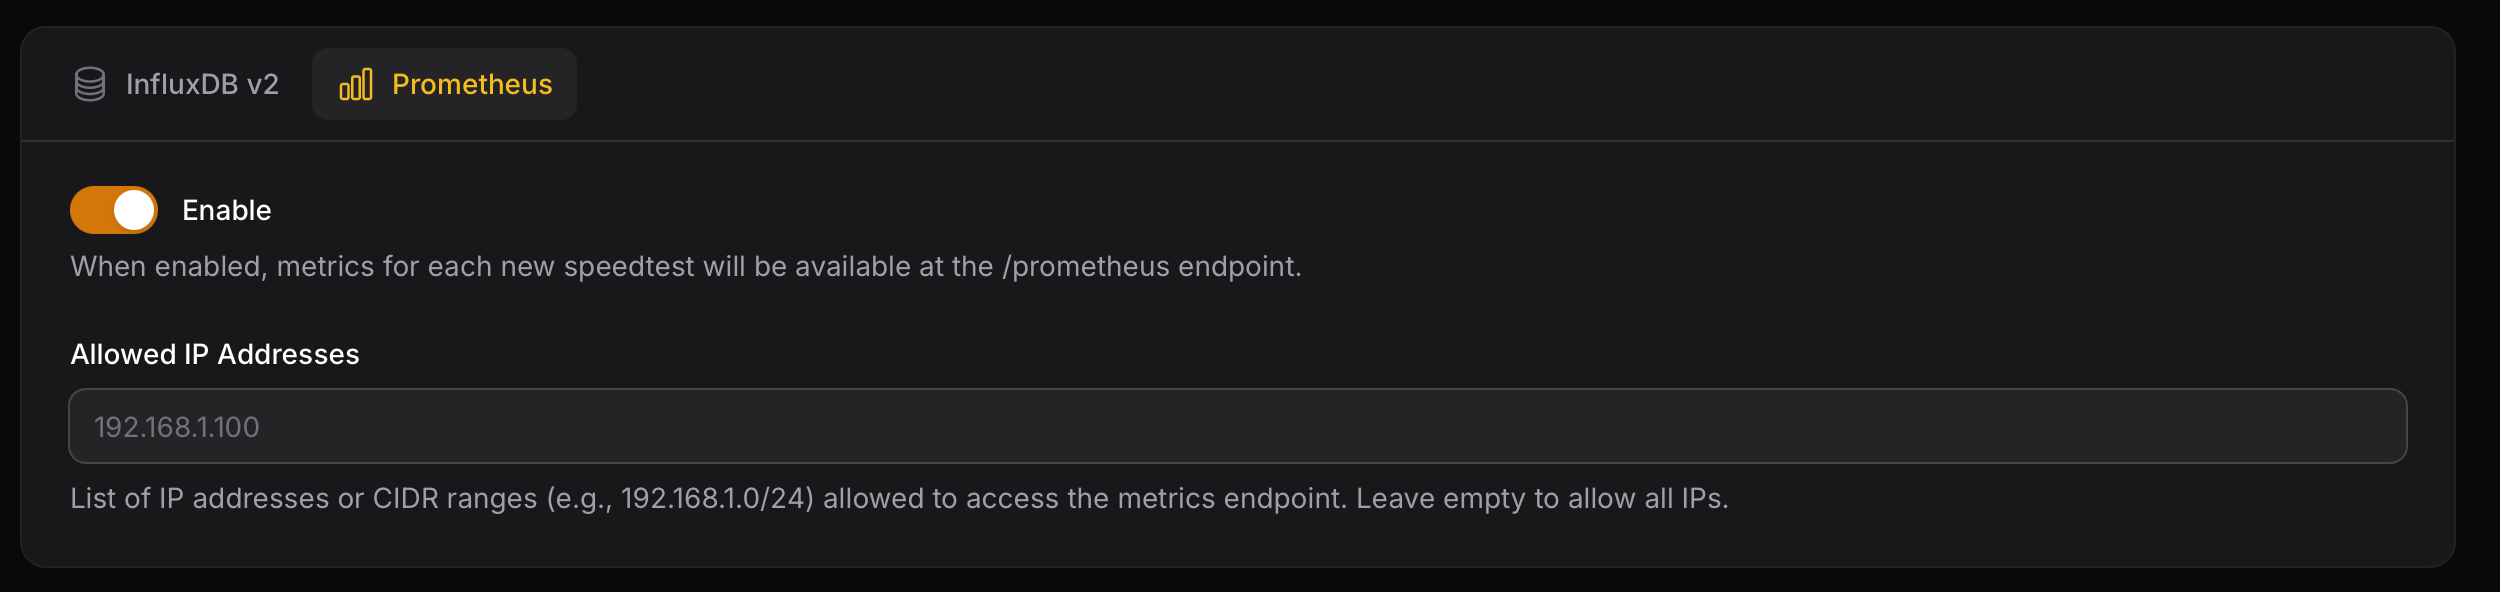
1. Activate Prometheus Integration like described here: https://docs.speedtest-tracker.dev/settings/data-platforms/prometheus

2. Configure Grafana to use your Prometheus instance.

4. Load Dashboard in Grafana

7. Enjoy