A web interface for line-profiler results.
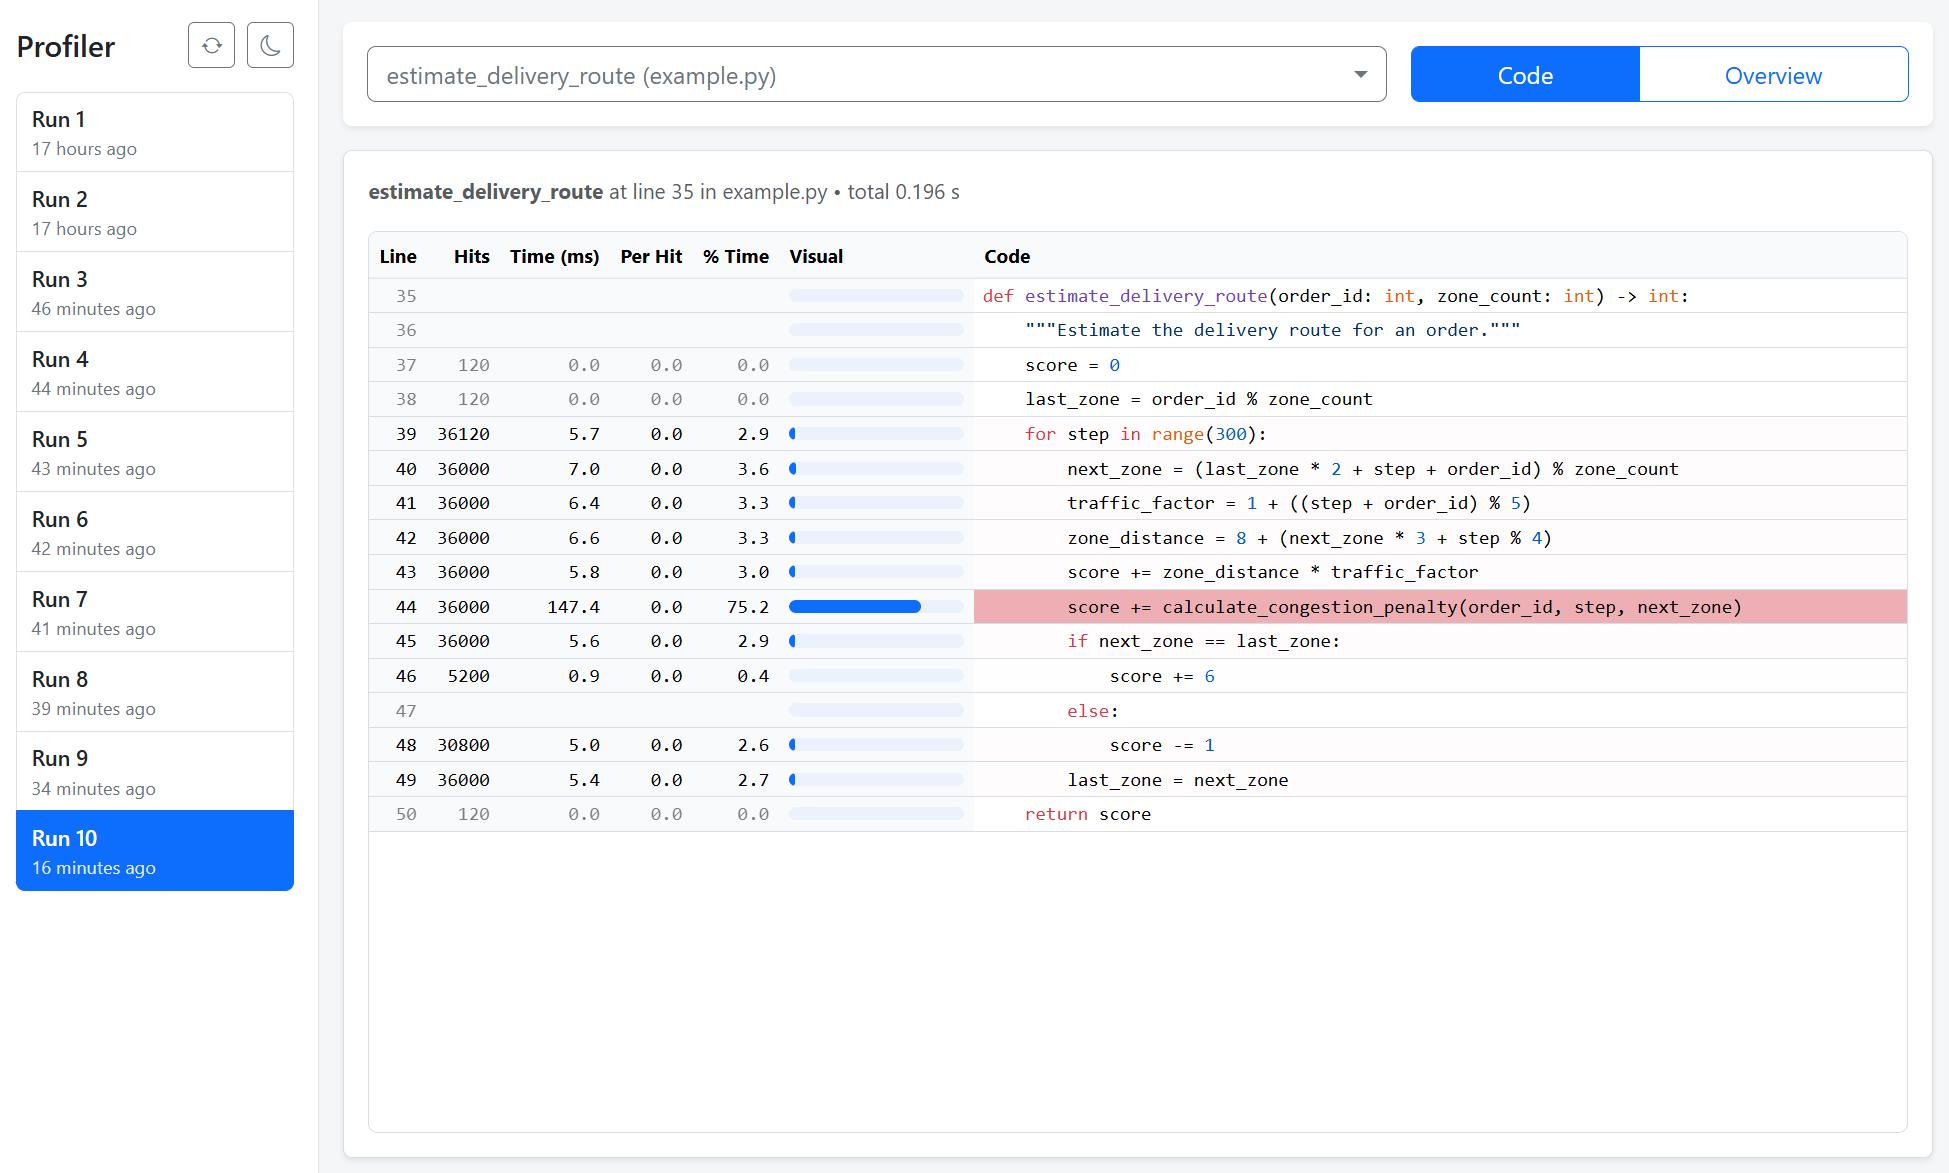
This is a web app for visualizing profiling results from Python's line-profiler. You can
- generate profiling results with
line-profiler - view profiling results of different runs
- view a summary table of function execution times
You can install it via pip from PyPI:
pip install line-profiler-webThe app serves a directory of profiling results, by default profile/ in the current working directory.
To start the app, run:
python -m line_profiler_web --port 8080 --profile-path profileOpen the page in your browser: http://127.0.0.1:8080/
Then you can use line-profiler to profile your code (see for example example.py):
def main():
    # your code here
    pass

def slow_subfunction():
    # your code here
    pass

if __name__ == "__main__":
    profile = True
    if profile:
        from line_profiler import LineProfiler
        from line_profiler_web import save_stats
        profile_dir = "profile"
        lp = LineProfiler()
        lp.add_function(main)
        lp.add_function(slow_subfunction)
        lp.run("main()")
        save_stats(lp, profile_dir)
    else:
        main()
Run your script:
python example.pyOpen the web page to view results. You can run your script multiple times (e.g. after code changes), each profile will be saved into a new file in the profile directory and all profile files are shown on the web page.
MIT