Why increasing the step/resolution produces holes in my graph? #5418
Unanswered
AntoineThebaud
asked this question in
Questions & Answers
Replies: 1 comment
-
|
After more investigations, the issue happens only when we go through the query-frontend component, and also only data stored in object storage and provided by thanos store as sidecar data is working as you can see on previous screen captures... |
Beta Was this translation helpful? Give feedback.
0 replies
Sign up for free
to join this conversation on GitHub.
Already have an account?
Sign in to comment
Uh oh!
There was an error while loading. Please reload this page.
Uh oh!
There was an error while loading. Please reload this page.
-
Thanos version:
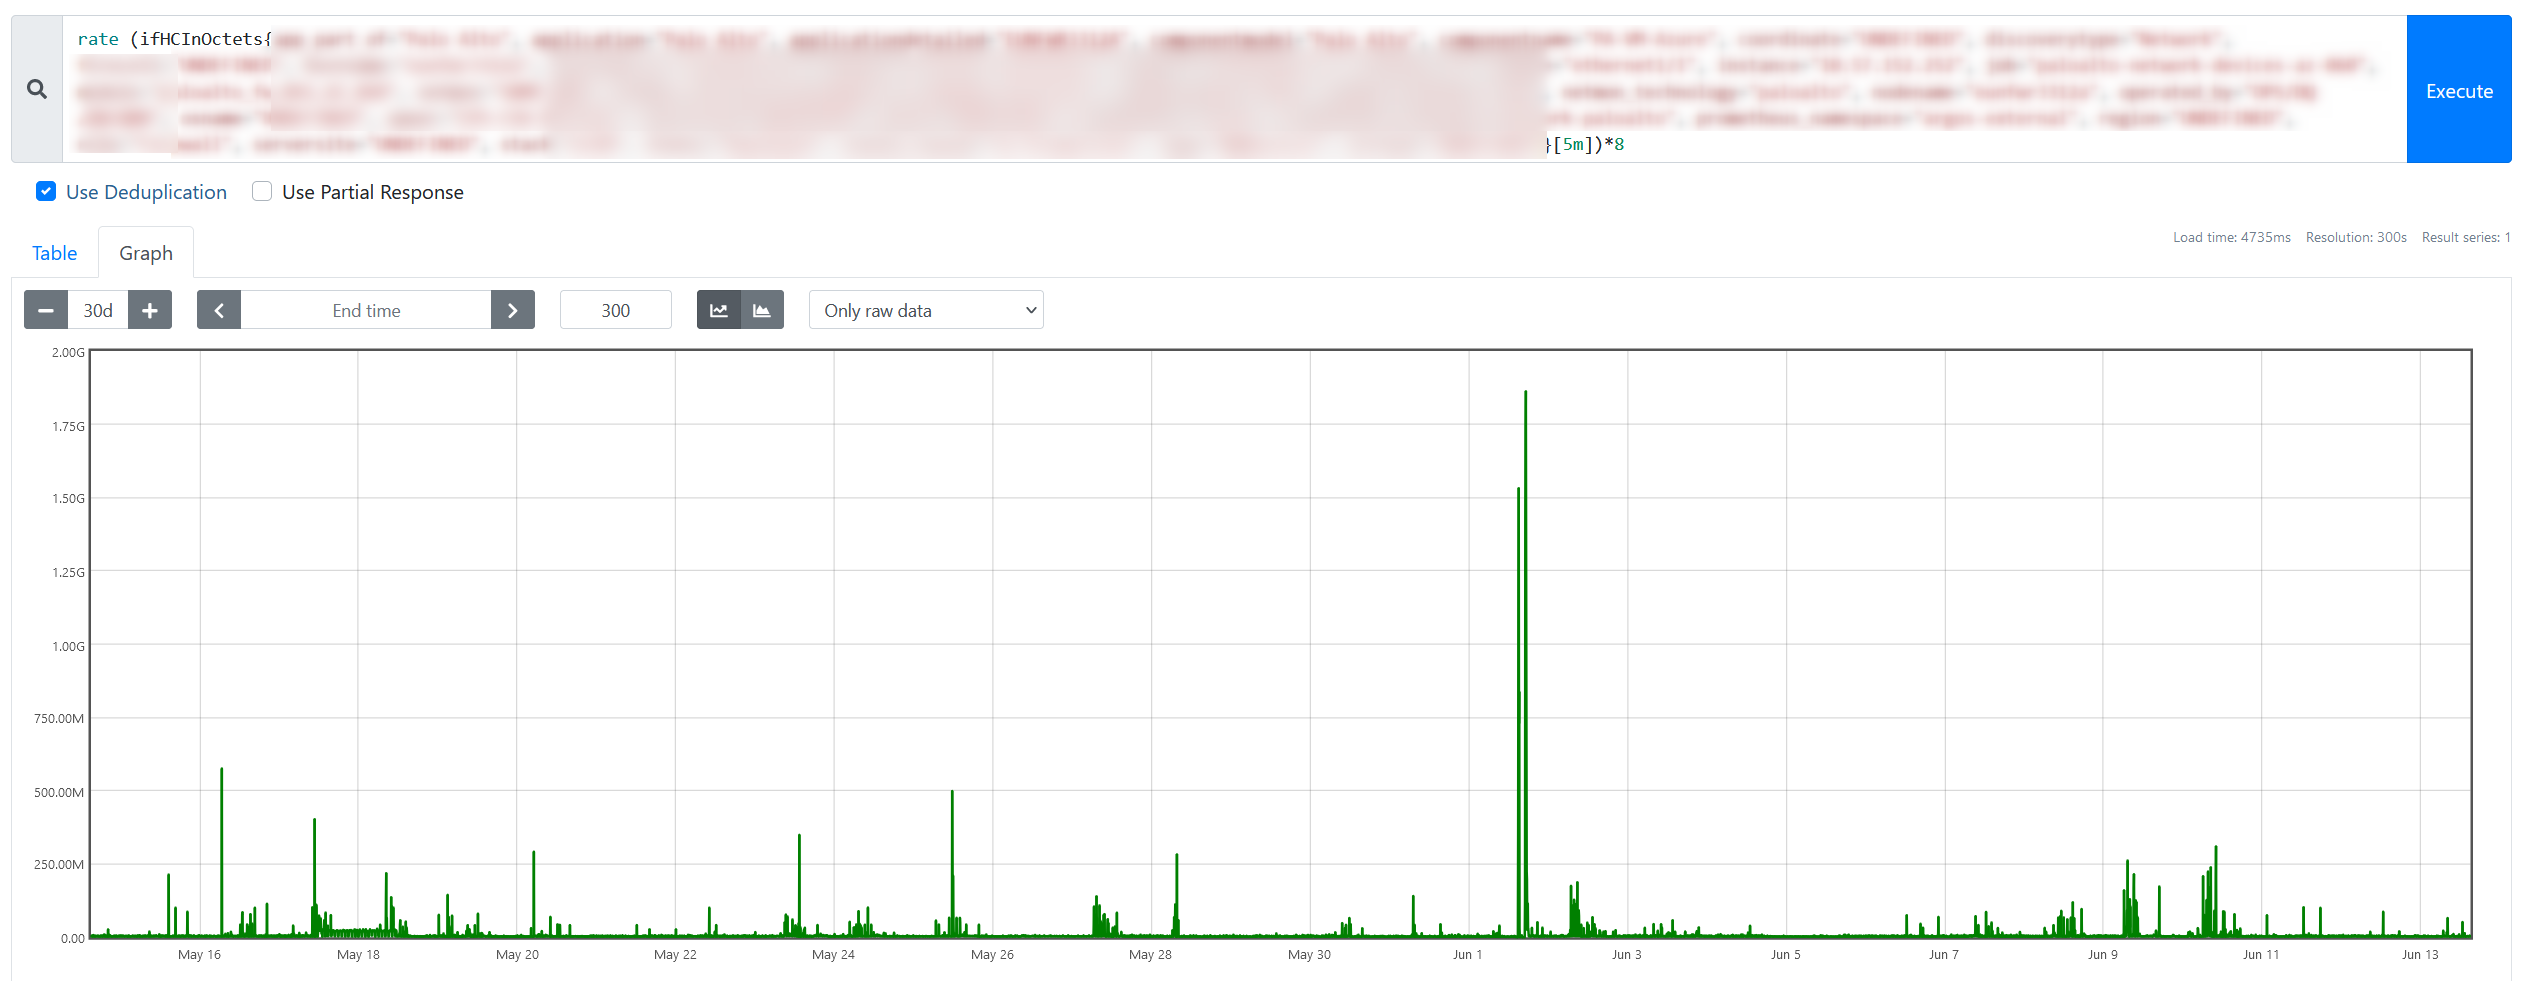
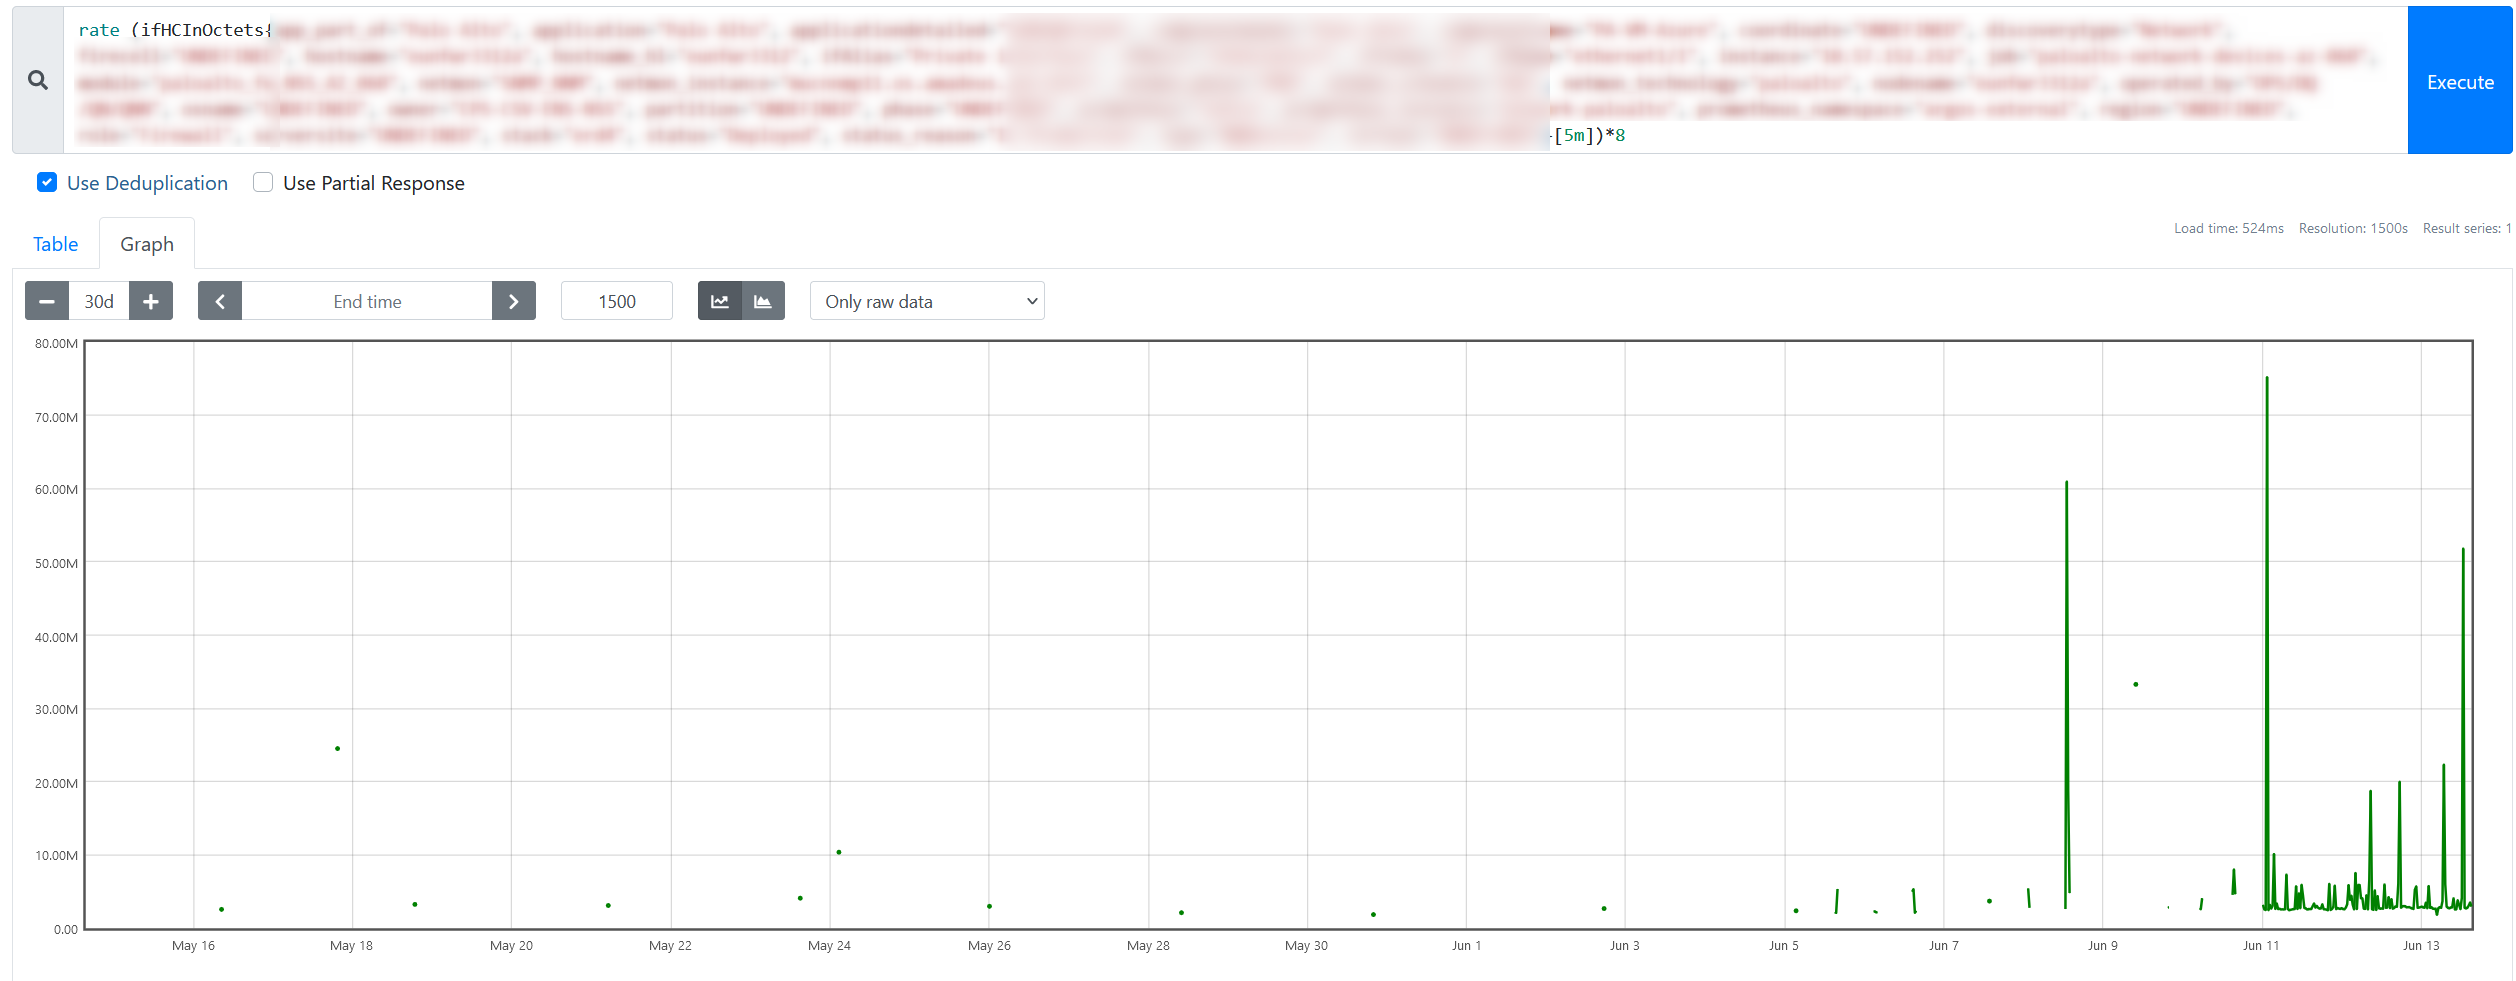
0.26.0Hello, there is a behavior I don't understand with Thanos: I'm trying to display a rate over a long period of time (30d), using only raw data.
With rate(5m) & a 5m resolution, all fine:
However with rate(5m) and 30m resolution:
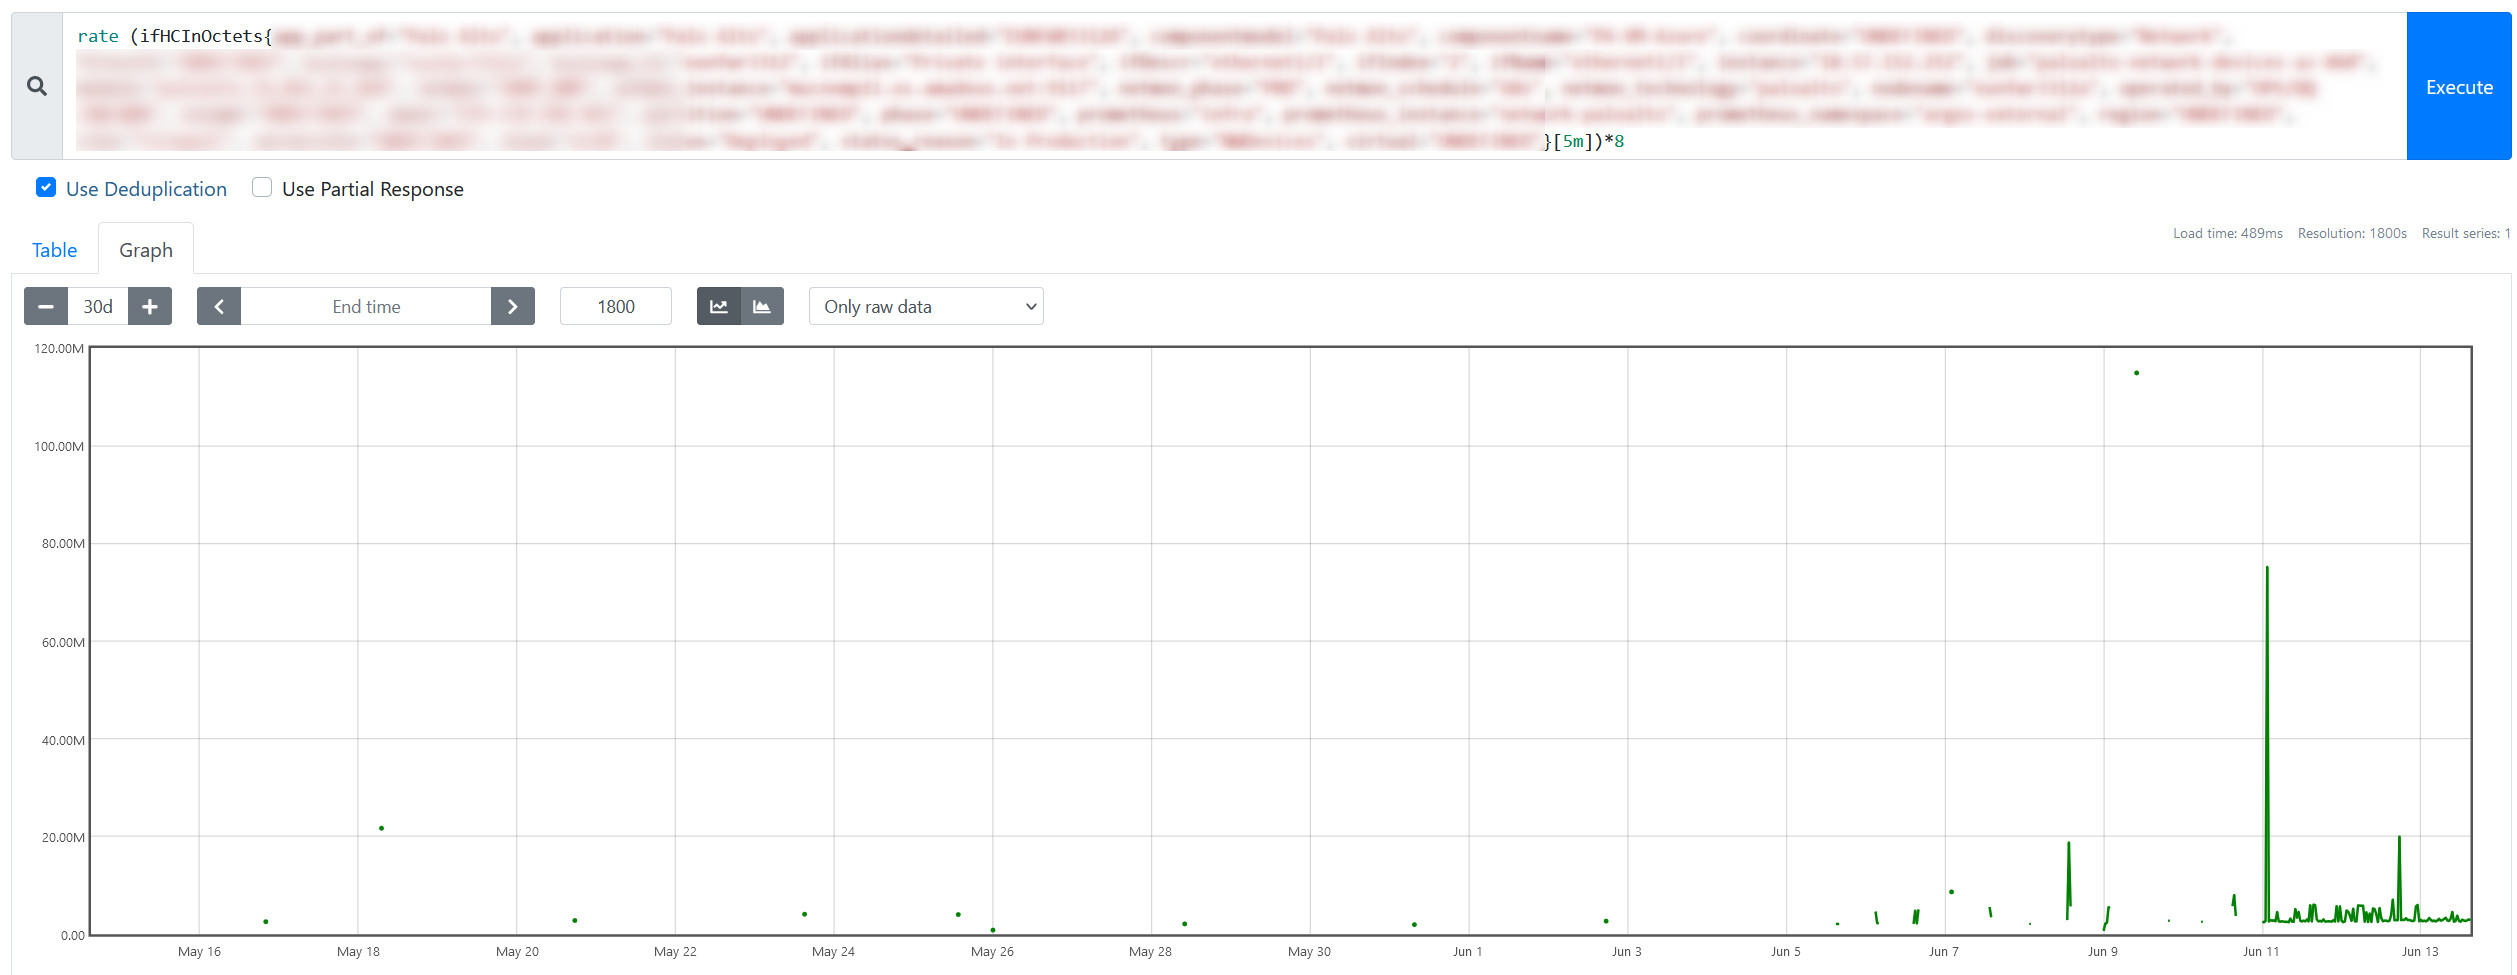
(It's working fine the 3 first days because prometheus is the master source of truth on this period)
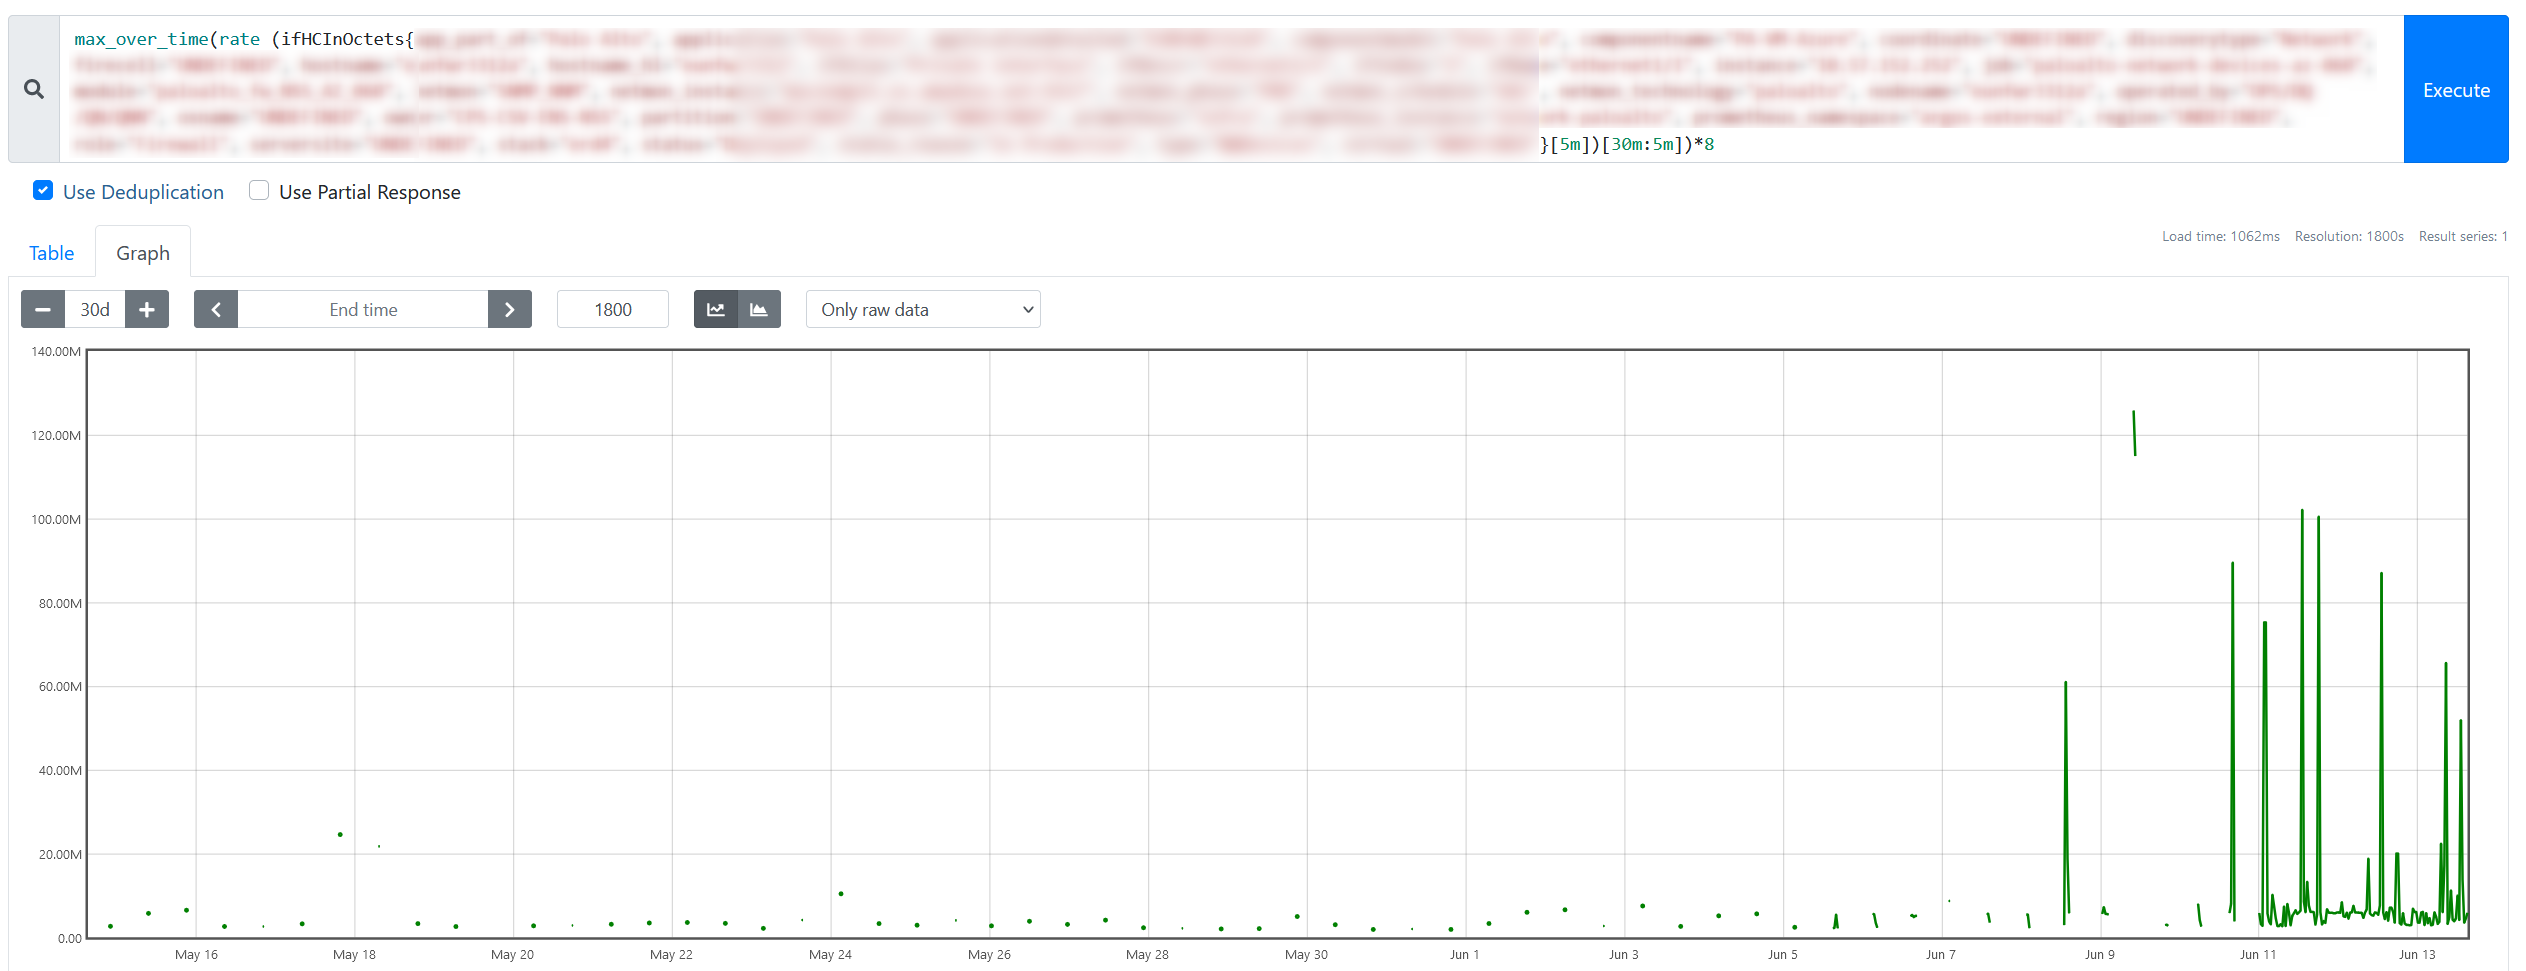
Displaying a rate(5m) every 30m is not a good idea anyway, but my real query is actually using max_over_time(30m) with a rate subquery & I face the same problem:
Is this behavior expected? I get the exact same result on Grafana UI btw. I thought the resolution param (step on Grafana) was a matter of FE display only, since I assumed "only raw data" was informing Thanos to use as much datapoints as it can for the computation (i.e every 1min here). But since the rate fails it seems increasing the resolution actually increases the gap between each point in the computation at some point, hence the fail?
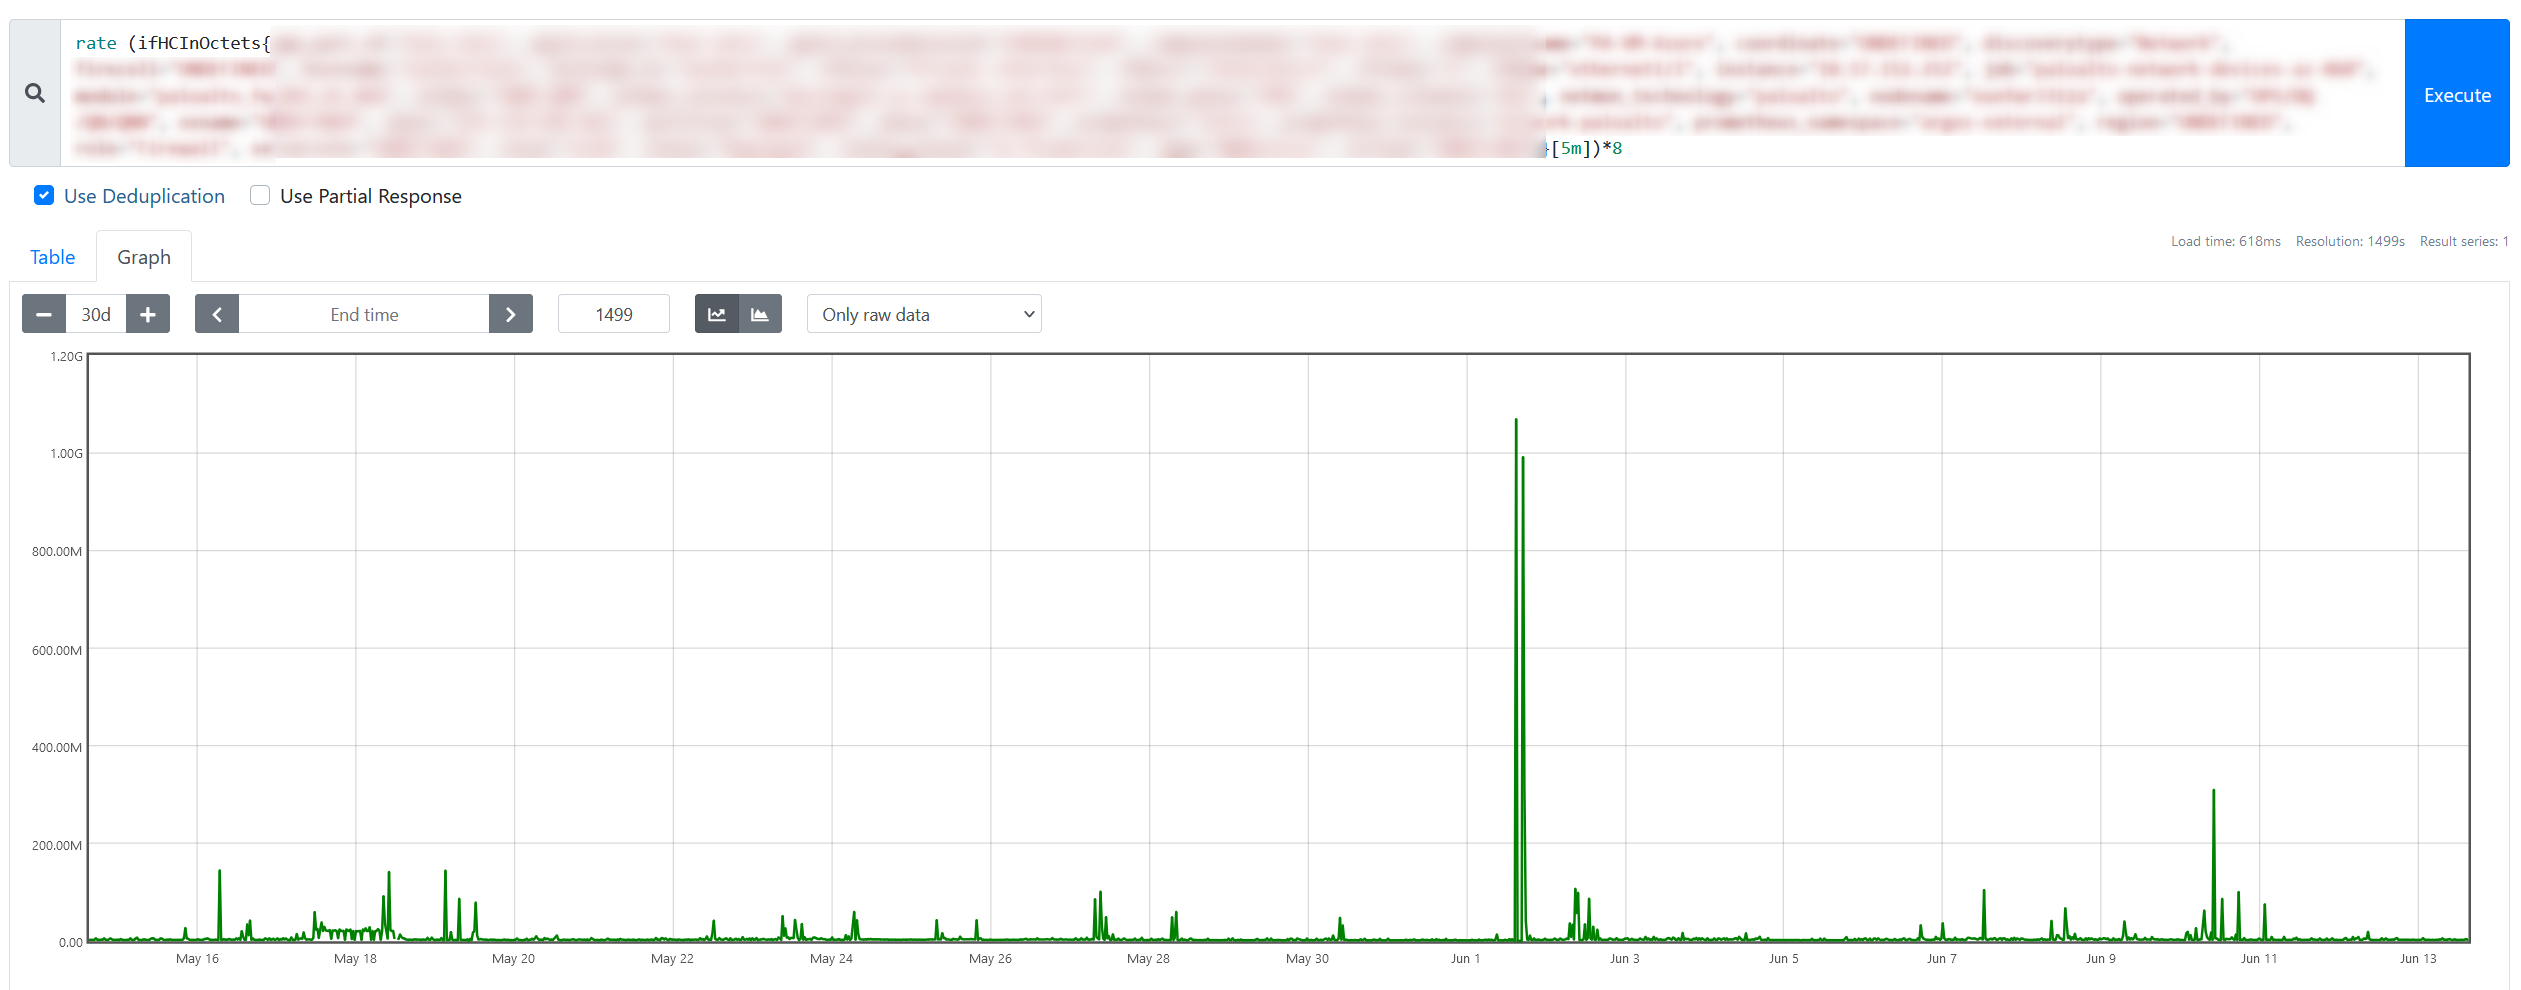
More precisely, with this example, there is a clear edge at 25m resolution (it's working fine until 24m59s)
Sorry in advance if this already answered/documented somewhere but in such case I didn't find the info.
Beta Was this translation helpful? Give feedback.
All reactions