Remove file handle caching from LilcomChunkyReader #737
Conversation
|
I just used https://github.com/k2-fsa/icefall/tree/master/egs/aishell/ASR/transducer_stateless_modified-2 to test this PR. The training command is ./transducer_stateless_modified-2/train.py \
--world-size 1 \
--num-epochs 20 \
--max-duration 100 \
--num-workers 2 \
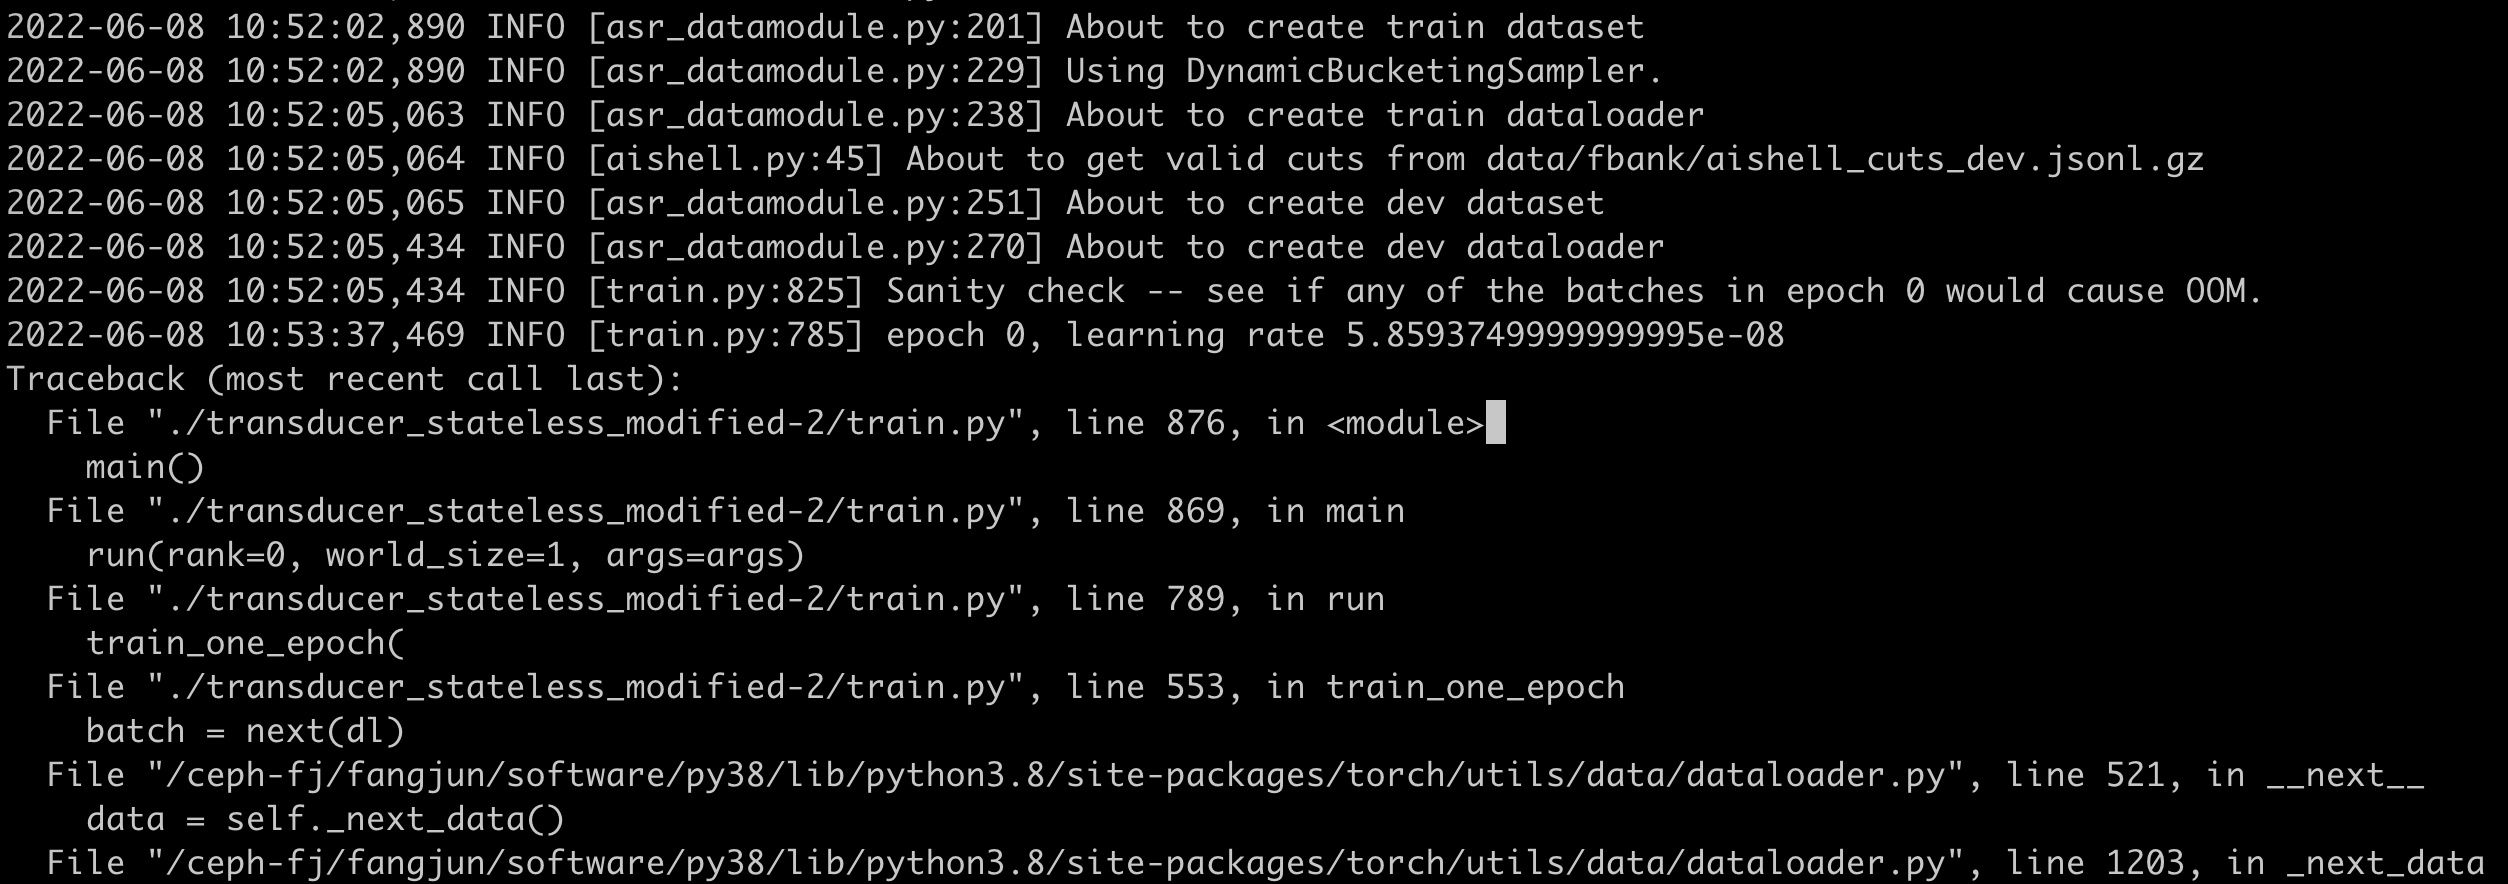
--datatang-prob 0.2I did two experiments to compare the time needed for sanity check between the master and this PR. Each experiment is repeated for three times. The following shows the logs of the two experiments. First experiment with the master branchRun 1Note that it throws due to lilcom decompression error. Run 2 and Run 3 have the same issue. We compare the time it needed
Run 2Run 3Second experiment with this PRRun 1Run 2Run 3The following table compares the time needed for sanity check for of each run:
So at least this PR does not affect the time needed for sanity check. |
|
NFS will cache the file in memory anyway, so possibly the file-opening thing is not such a huge deal. |
|
Thanks, merging |
|
Here is another experiment using ./pruned_transducer_stateless2/train.py \
--world-size 1 \
--num-epochs 30 \
--start-epoch 0 \
--exp-dir pruned_transducer_stateless2/exp \
--full-libri 0 \
--max-duration 300 \
--num-workers 2First experiment with the master branchRun 1Due to the time needed for each run, each experiment is repeated only twice and we compare the time needed for 50 batches, i.e., from Run 2Second experiment with this PRRun 1Run 2The following table compares the time needed from
So again this PR does not seem to affect the training speed. Note: One thing I do notice is that the time for 50 batches is rather long (>4 minutes). |
|
Hmm that’s unexpected. Can you check lazy + HDF5 to pinpoint the exact reason for this slowdown? |
I am testing whether it is caused by different disks. |
|
I think the main reason for the slowdown is due to
Here is the time needed for
From the above table, I recommend not using
|
|
Note that if you use load_manifest instead of load_manifest_lazy, you just pay the price of long waiting for the data to be read into memory earlier in the script. I will make h5py an optional dependency not installed by default. Thanks. |
|
I wonder whether this performance issue with load_manifest_lazy could be fixed somehow? It seems to me like it might be unnecessary. In any case it's odd, IMO. |
|
I think it’s due to the sampler having to read and decode ~20k cuts from disk at the start of iteration, instead of inside asr_datamodule. The code for both loading methods is not very different; load_manifest_lazy performs a few extra checks in if statements to determine the type of read objects. I would be surprised if it was a bottleneck. You can try to measure the time needed for load_manifest to see if it’s much smaller than 90s. |
Here are the logs for the above runs. You can see that Also, it takes more than 4 minutes for the run that uses LilcomChunkyWriter (jsonl) | load_manifest_lazy | dynamic bucketingLilcomChunkyWriter (jsonl) | load_manifest | dynamic bucketing |
|
I suspect it must be some bug in load_manifest_lazy. A few checks shouldn't do this, it would have to be something major, e.g. a loop of some kind. |
|
Before accepting that it’s a bug, I’d need to know how much time it takes to run |
|
Anyway I’ll take a look at it, I agree that it shouldn’t be slower / doing extra work. |
|
I give you some training logs here for two runs using Note: I am not saying that training with load_manifesttraining with load_manifest_lazyIn the logs,
|
|
I just used The main threadtrain-main-thread.movDataloaderdata-loader.movThe following is the output Note I am using GPU 1. nvidia-smi.mov |
|
Here are the screen recordings for the run using You can see that the GPU is almost fully utilized all of the time. The main threadmain-thread.movThe dataloader processdata.loader.movnvidia-smiScreen.Recording.2022-06-09.at.10.15.26.AM.mov |
|
I can't see anything in the data-loader's video that looks like it's spending any time loading the manifest lazily. |
Yes, they are on the same disk. I will try to use |
|
First of all, thanks for the amazing level of detail in the debug info! I have a hypothesis… are you using |
|
I suspect the reason is due to using I just tried the following settings:
The above two settings are both fast.
The above two settings are very slow. |
I am using either |
|
Yeah I just checked — To prevent future issues with this, I will try to locate all places in the codebase that have hard assumptions about lazy/eager manifests and add relevant assertions. |
Thanks. Then I will use |
|
BTW since you have the profiling setup for this, do you mind trying out the async cut loading for dynamic bucketing in #680? |
This should resolve #607 at the cost of some speed possibly. On a local system with fast CPU and SSD, iterating dataloader from 4 lilcom chunky archives with 8 workers using mini-librispeech, I got the following:
There is a tiny difference which could be larger on slow systems. @csukuangfj you did something similar before; did you notice a slowdown of training? Anyway I think we should merge it, it's better to be a bit slower but correct..