library("tinyplot")
plt(demand ~ Time, data = BOD, type = "barplot")
plt_add(type = "text", pos = 3, xpd = NA)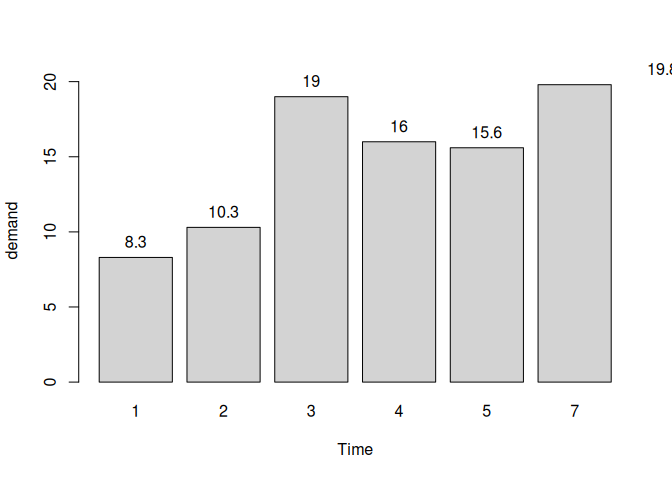
The above case is kind of misleading; the first few bars + text only align because the x-axis starts at 1. We don't even see the text if the numbers start higher up:
plt(GNP ~ Year, data = longley[1:5, ], type = "barplot")
plt_add(type = "text", pos = 3, xpd = NA)
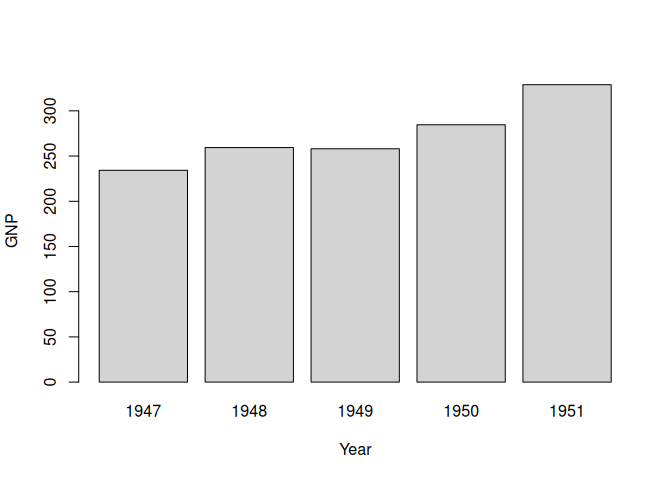
Created on 2026-08-28 with reprex v2.1.1
If I'm not mistaken, this is the same problem as the "x as numeric" violin case here: #441 (comment).
I believe it has an easy fix...
The above case is kind of misleading; the first few bars + text only align because the x-axis starts at 1. We don't even see the text if the numbers start higher up:
Created on 2026-08-28 with reprex v2.1.1
If I'm not mistaken, this is the same problem as the "x as numeric" violin case here: #441 (comment).
I believe it has an easy fix...