This tool is intended to retrieve a basic review count for the pull requests for a GitHub organization in a given time frame. The default time from is 2 weeks. The tool will retrieve statistics only on all repositories in the specified organization unless there are specific languages specified.
This tool uses the GitHub API to retrieve the data. The tool requires that
you have your GitHub token set as an environment variable. The environment
variable should be named GITHUB_TOKEN.
basic usage:
review-tally -o expressjs --languages javascriptwhich would produce the following output
User                                  Reviews    Comments    Avg Comments
----------------------------------  ---------  ----------  --------------
Phillip9587                                11           3             0.3
bjohansebas                                 6           0             0
UlisesGascon                                5           0             0
tausiq2003                                  2           2             1
copilot-pull-request-reviewer[bot]          2           1             0.5
AkashDev01                                  1           2             2
Cycloctane                                  1           1             1
lululolily                                  1           1             1
avivkeller                                  1           1             1
ShubhamOulkar                               1           1             1
SleepyStew                                  1           0             0
shivarm                                     1           0             0
LinusU                                      1           0             0
This output shows the number of reviews that each user has carried out in the time period for the repositories that have python as a language specified.
A comma separated list of languages can be provided to filter the repositories that are included in the statistics. If no languages are provided then all of the repositories will be included in the statistics.
review-tally reviews,comments,avg-comments,\
engagement,thoroughness,response-time,\
completion-time,active-days -o expressjs
User Reviews Comments Avg Comments Engagement Thoroughness Avg Response Review Span Active Days
---------------------------------- --------- ---------- -------------- ------------ -------------- -------------- ------------- -------------
Phillip9587 11 3 0.3 Low 6% 1.2d 1.2d 2
bjohansebas 6 0 0 Low 0% 1.8d 7.0d 2
UlisesGascon 5 0 0 Low 0% 1.2d 7.0d 5
tausiq2003 2 2 1 Medium 25% 4.3d 0m 1
copilot-pull-request-reviewer[bot] 2 1 0.5 Medium 12% 3.7d 0m 1
AkashDev01 1 2 2 High 50% 4.2d 0h 1
Cycloctane 1 1 1 Medium 25% 19.4h 0h 1
lululolily 1 1 1 Medium 25% 19.8h 0h 1
avivkeller 1 1 1 Medium 25% 22.0h 0h 1
ShubhamOulkar 1 1 1 Medium 25% 6.3d 0h 1
SleepyStew 1 0 0 Low 0% 43m 0h 1
shivarm 1 0 0 Low 0% 35m 0h 1
LinusU 1 0 0 Low 0% 4.9d 0h 1
multiple languages:
review-tally -o crossplane --languages python,goAll languages:
review-tally -o expressjsSpecifying the time frame:
review-tally -o expressjs --languages javascript -s 2021-01-01 -e 2021-01-31You can use the long-form flags as well (note the hyphenated names):
review-tally -o expressjs --languages javascript --start-date 2021-01-01 --end-date 2021-01-31Customizing metrics displayed:
review-tally -o expressjs --languages javascript -m reviews,engagement,thoroughnessIf aggregate data is required sprint over sprint then the --sprint-analysis
option can be used. This will produce a CSV file with the data for each sprint.
review-tally -o expressjs --languages javascript --sprint-analysis --output-path sprint_analysis.csvThe tool can generate interactive charts showing sprint metrics over time. You can use --plot-sprint to create visualizations that open in your browser.
review-tally -o expressjs --languages javascript --plot-sprintreview-tally -o expressjs --languages javascript --plot-sprint --chart-type line --chart-metrics total-reviews,unique-reviewersreview-tally -o expressjs --languages javascript --plot-sprint --save-plot sprint_metrics.htmlreview-tally -o expressjs --languages javascript --sprint-analysis --plot-sprint --output-path sprint_data.csv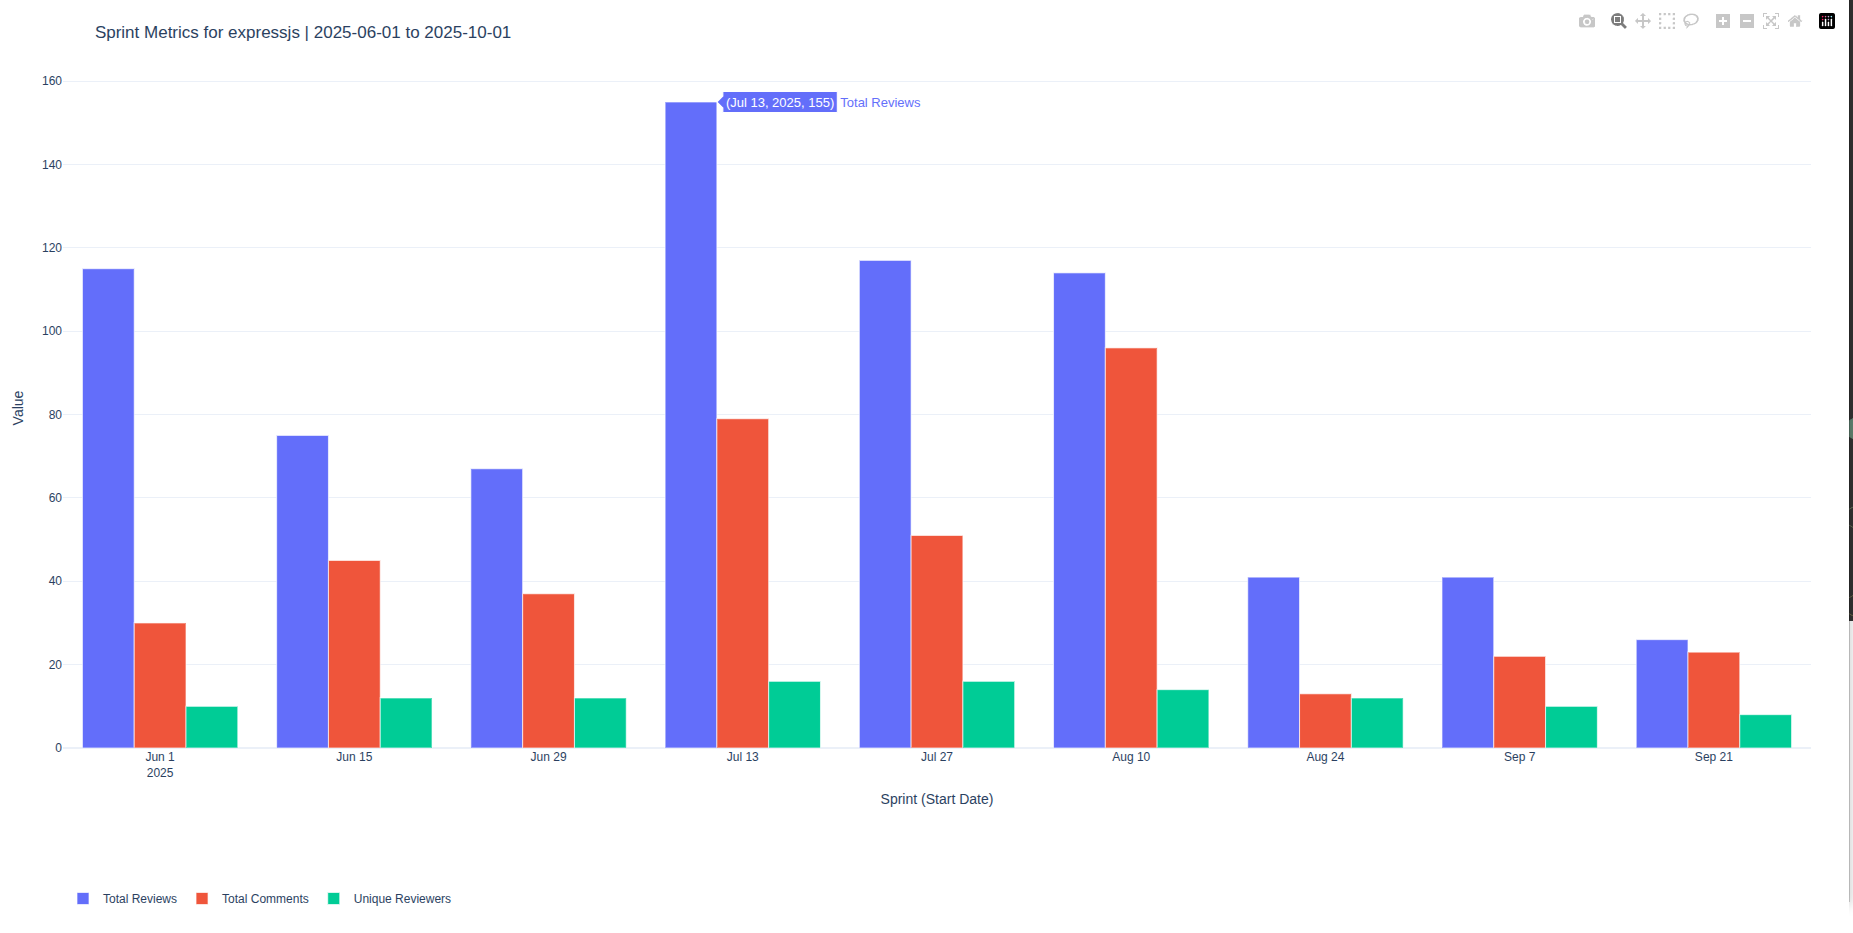
The tool can generate pie charts showing the distribution of metrics across individual reviewers. Use --plot-individual to create interactive pie charts that open in your browser.
review-tally -o expressjs --languages javascript --plot-individual# Show engagement level distribution
review-tally -o expressjs --languages javascript --plot-individual --individual-chart-metric engagement_level
# Show thoroughness score distribution
review-tally -o expressjs --languages javascript --plot-individual --individual-chart-metric thoroughness_score
# Show comment distribution
review-tally -o expressjs --languages javascript --plot-individual --individual-chart-metric commentsreview-tally -o expressjs --languages javascript --plot-individual --save-plot reviewer_distribution.html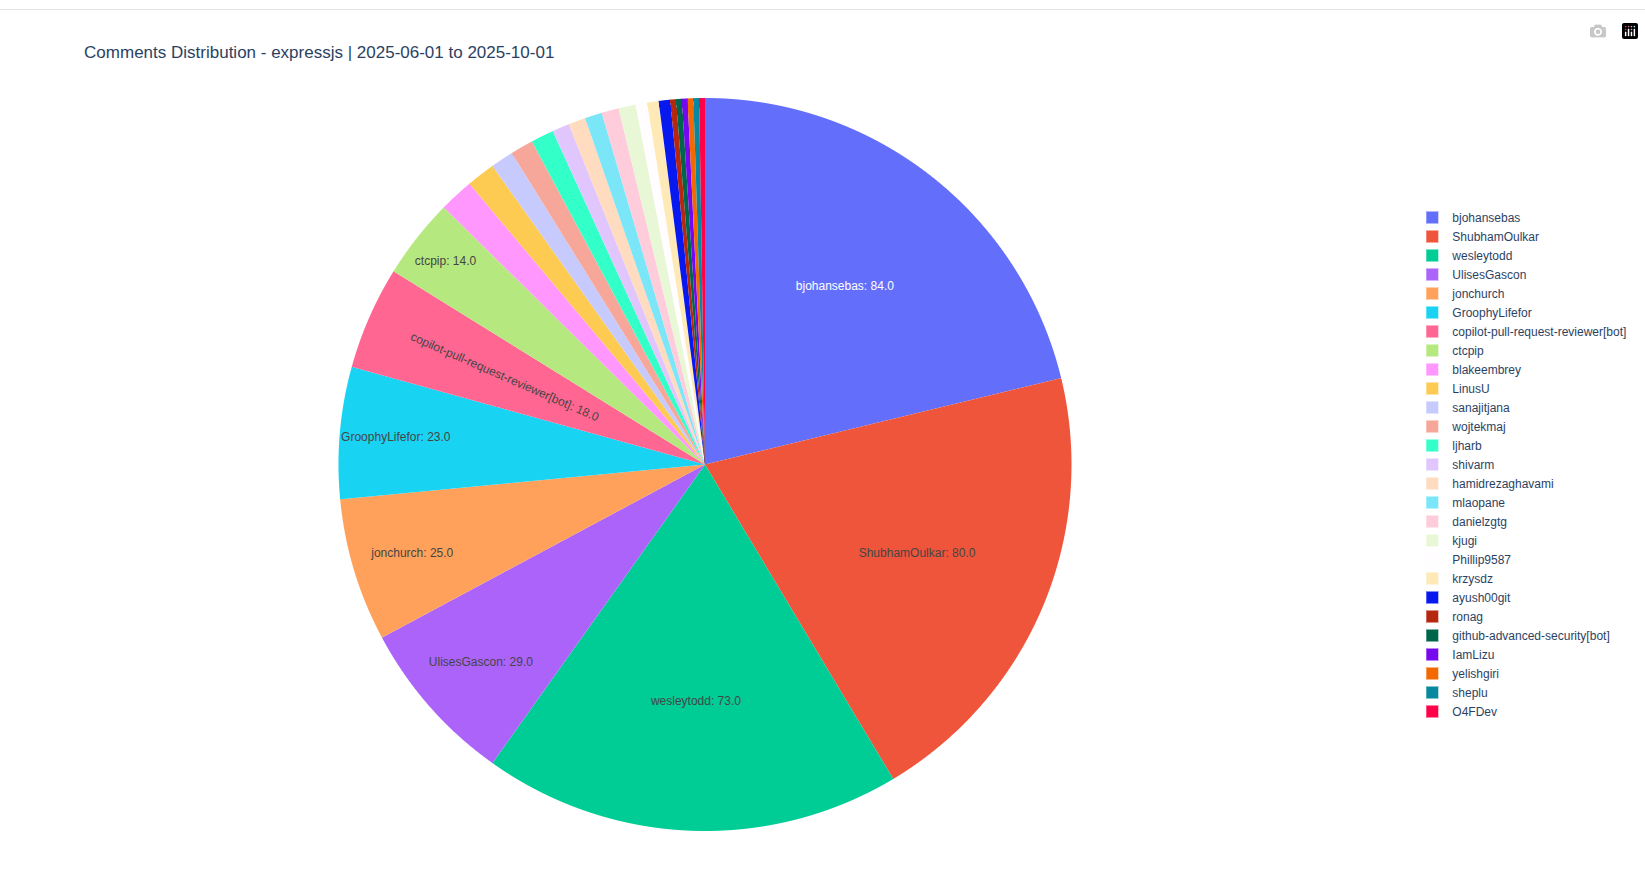
reviews- Number of reviews per reviewer (default)comments- Number of comments per reviewerengagement_level- Engagement level (High/Medium/Low)thoroughness_score- Thoroughness percentage scoreavg_response_time_hours- Average response time in hoursavg_completion_time_hours- Average completion time in hoursactive_review_days- Number of active review days
- -c, --config Path to a TOML configuration file containing CLI options
- -o, --org The GitHub organization that you want to query
- -l, --languages A comma separated list of languages that you want to include
- -s, --start-date The start date for the time frame that you want to query (optional)
- -e, --end-date The end date for the time frame that you want to query (optional)
- -m, --metrics Comma-separated list of metrics to display (reviews,comments,avg-comments,engagement,thoroughness). Default: reviews,comments,avg-comments
- --github-host Base host used for GitHub API requests. Defaults to api.github.com
- --github-rest-path Optional base path appended to REST API requests. Defaults to none or the path embedded in
--github-host - --github-graphql-path Optional path to the GraphQL endpoint. Defaults to
/graphqlor mirrors the REST path - -h, --help Show this message and exit
- -v, --version Show the version of the tool
- --sprint-analysis selects the sprint analysis option
- --output-path specifies the output file for sprint analysis
- --plot-sprint Generate interactive charts showing sprint metrics (opens in browser)
- --chart-type Chart type for sprint metrics (bar or line). Default: bar
- --chart-metrics Comma-separated sprint metrics to plot. Default: total_reviews,total_comments. Available: total-reviews,total-comments,unique-reviewers,avg-comments-per-review,reviews-per-reviewer,avg-response-time-hours,avg-completion-time-hours,active-review-days
- --save-plot Optional path to save the interactive HTML chart
- --plot-individual Generate pie charts showing individual reviewer metric distribution (opens in browser)
- --individual-chart-metric Metric to visualize in individual pie chart. Default: reviews. Available: reviews,comments,engagement_level,thoroughness_score,avg_response_time_hours,avg_completion_time_hours,active_review_days
- --no-cache Disable PR review caching (always fetch fresh data from API). By default, caching is enabled for better performance.
- --clear-cache Clear all cached pull request data and exit
- --clear-expired-cache Clear only expired cached data and exit
- --cache-stats Show cache statistics and exit
You can provide all CLI options via a TOML configuration file by passing the --config flag. Each setting uses the same name (with dashes) as
its corresponding long-form CLI option, and command line values continue to override anything defined in the file. In addition
to the existing switches, configuration files support a repositories list that lets you target specific repositories without
providing an organization. Repositories must be defined in owner/repository-name format.
Example configuration:
# basic time window and filters
start-date = "2023-01-01"
end-date = "2023-01-15"
languages = ["python", "javascript"]
metrics = ["reviews", "comments"]
github-host = "https://ghe.example.com"
github-rest-path = "/api/v3"
github-graphql-path = "/api/graphql"

# sprint analysis output and plotting
sprint-analysis = true
output-path = "sprint.csv"
plot-sprint = true
chart-type = "line"
chart-metrics = ["total_reviews", "unique_reviewers"]
save-plot = "sprint_plot.html"

# caching controls
no-cache = true
clear-cache = true
clear-expired-cache = true
cache-stats = true

# repositories to process (no --org needed)
repositories = [
  "octocat/hello-world",
  "cli/review-tally",
]
When repositories is supplied the tool skips organization discovery and queries each repository owner pair directly.
Set github-host when targeting GitHub Enterprise and adjust github-rest-path / github-graphql-path if your deployment uses
custom routes (for example /api/v3 for REST and /api/graphql for GraphQL).
This tool uses GitHub's REST and GraphQL APIs extensively to gather pull request and review data. GitHub enforces rate limits to ensure fair usage of their API resources.
GitHub API rate limits vary depending on your authentication method:
- Personal Access Token: 5,000 requests per hour
- GitHub App: 15,000 requests per hour (per installation)
- OAuth App: 5,000 requests per hour (per user)
For GraphQL API:
- Personal Access Token: 5,000 points per hour (each query has a different point cost)
You can check your current rate limit status using curl:
# Check REST API rate limit
curl -H "Authorization: Bearer YOUR_GITHUB_TOKEN" \
     -H "Accept: application/vnd.github.v3+json" \
     https://api.github.com/rate_limit

# Check GraphQL API rate limit
curl -H "Authorization: Bearer YOUR_GITHUB_TOKEN" \
     -H "Accept: application/vnd.github.v3+json" \
     https://api.github.com/rate_limit | jq '.resources.graphql'
Replace YOUR_GITHUB_TOKEN with your actual GitHub personal access token.
- Use caching: This tool includes built-in caching (enabled by default) to reduce API calls
- Smaller time ranges: Process smaller date ranges to avoid hitting limits on large organizations
- Monitor usage: Use the curl commands above to monitor your rate limit consumption
- GitHub Apps: Consider using a GitHub App for higher rate limits if processing very large datasets