


Where your Claude Code money went.
Claude Code already writes a log for every session. ccvitals just reads them. Nothing leaves your machine, nothing is written outside its own install, and uninstalling leaves no trace.
npx ccvitals              # try it
npm install -g ccvitals   # keep it
Needs Node 20 or newer.
While a session is running:
ccvitals statusline |
a panel for Claude Code's status line |
ccvitals context |
what is filling the context window |
Afterwards:
ccvitals |
where the money went, today and this week |
ccvitals sessions |
recent sessions with cost, duration, and turns |
ccvitals doctor |
anything it could not parse or price |
Your status line says the window is 91% gone. This says what took it.

What you are hunting for is a file read many times over. Each read puts the same bytes in the window again, and the count on the right makes that visible.
The fill and the startup line are exact. The split below them is estimated and
says so: every estimated number wears a ~, and a footnote tells you how much
of the window the log could actually see. The
design notes have the working.
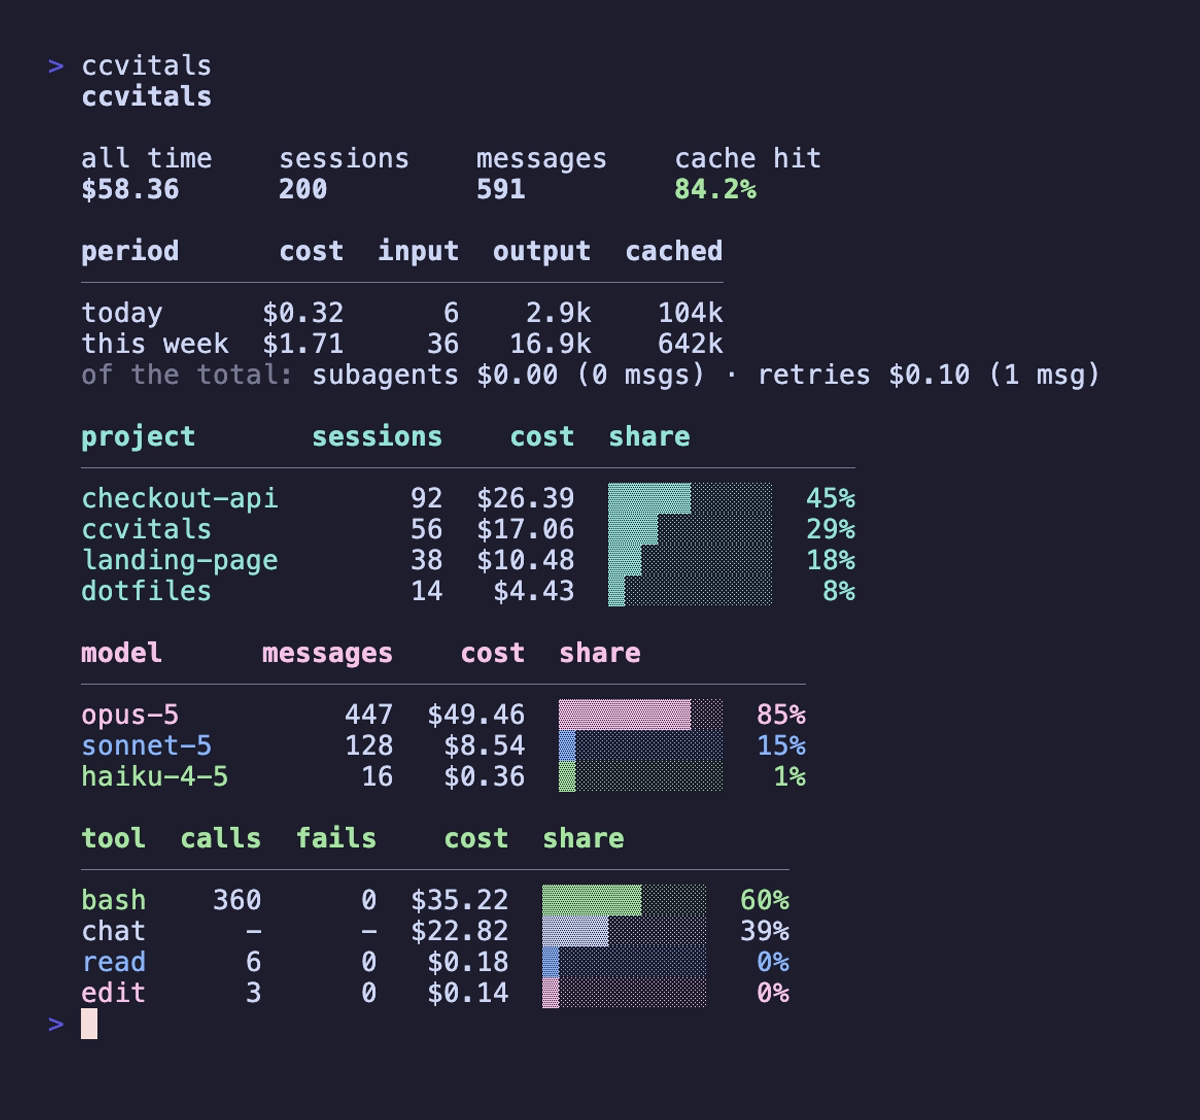
ccvitals on its own is today and this week, then totals by project, model
and tool.
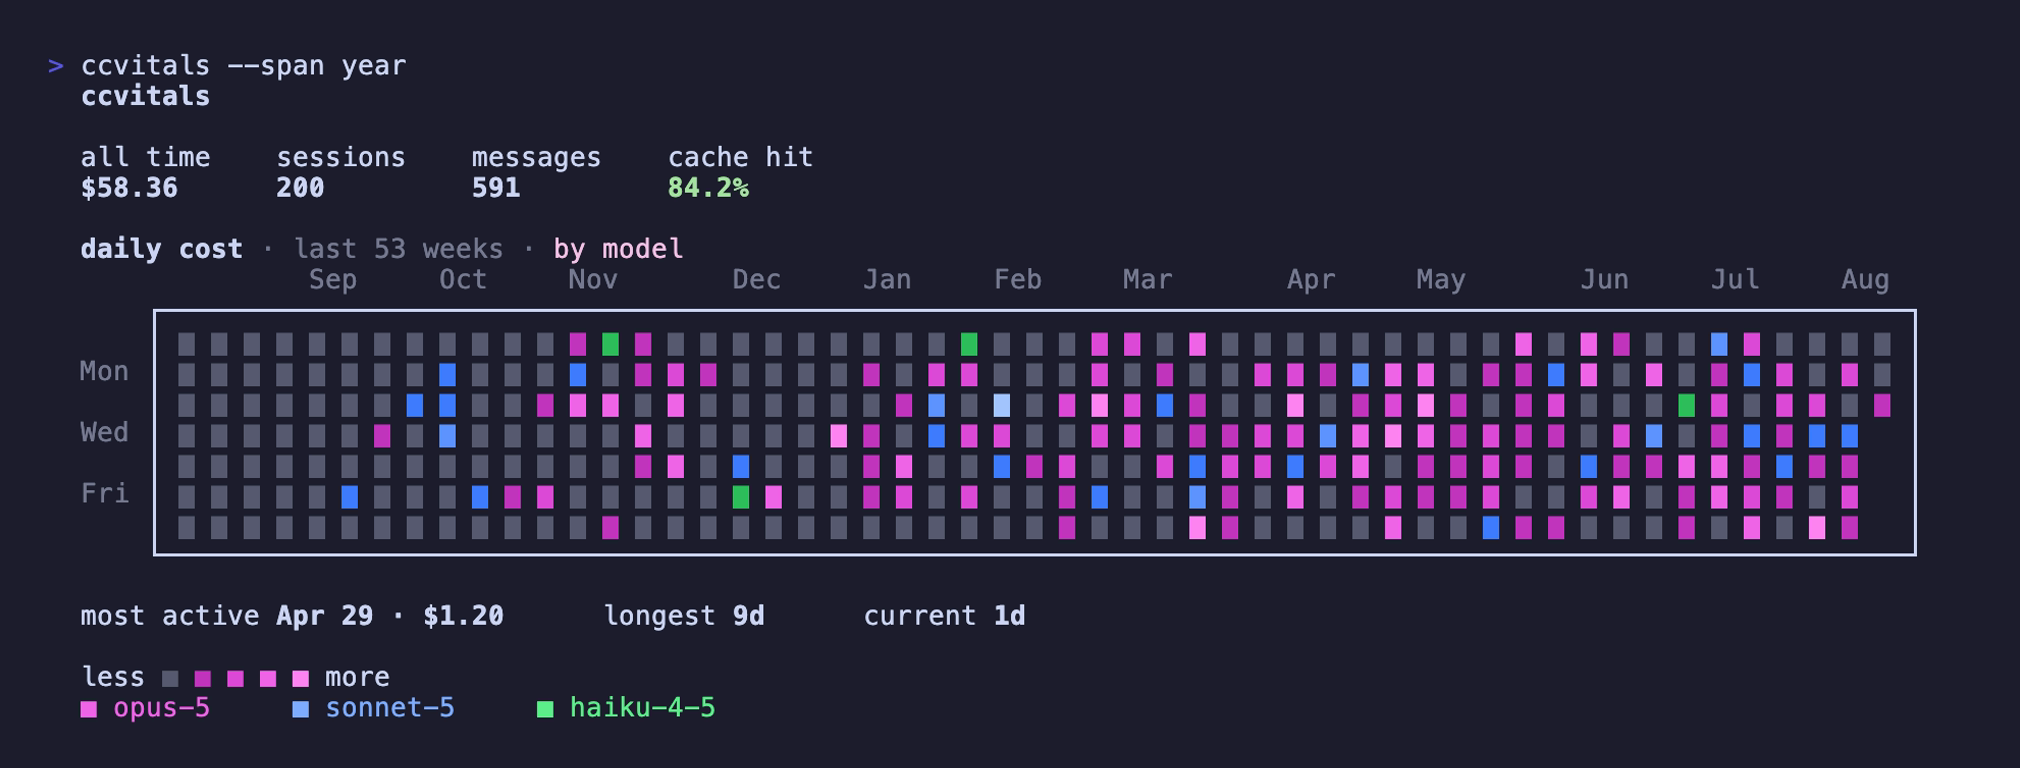
--span year puts the graph at the top of this page above those tables: one
square per day, tinted by whichever model spent the most on it and brightening
with how much. Piped or under NO_COLOR, where brightness cannot say it, the
squares become a shade ramp that can.
ccvitals sessions lists them newest first. --grep searches what you typed
and shows the line that matched.
One row each for what is running, what it cost, how much context is left and how much quota is left. Wasted is what you paid for retries and abandoned branches. The cache share is usually the difference between a cheap session and an expensive one.

{ "statusLine": { "type": "command", "command": "ccvitals statusline" } }Goes in ~/.claude/settings.json. If the bar comes up blank, use absolute
paths: a status line runs in a bare shell that may not know about your version
managed node. Rate limits need a Pro or Max plan.
--json and --no-color work on every command, and --project, --since
and --until narrow any of the reports. The rest belong to one command each:
--span |
dashboard, one of week, month or year |
--limit, --model, --grep |
sessions |
--window <tokens> |
context |
--ascii |
everywhere except sessions, which prints no glyphs |
Color never carries meaning on its own. It repeats what a glyph, a column or a
heading already said, so NO_COLOR, --no-color and piping to a file all read
the same. Red always means something failed, yellow always wants your
attention, and nothing else uses those two.
Start with ccvitals doctor. A model with no price still gets its tokens
counted and its cost marked unknown rather than guessed at. Prices live in
src/cost/pricing.json, one file keyed by model. Pull requests adding a new
model are very welcome.
MIT