Proposal for VisualizationWidgets class organization #239
Description
This is a draft / work in progress. As we are finishing #232 and I am switching to work in other projects I wanted to write my thoughts of what could be a general schema or abstract class for the visualization widgets in the library. Two preliminary points:
- I am not sure yet if going all the way to an abstract class at this point is useful (or if it will be ever be). Visualization is a category that is difficult to formalize and maybe over-constraining the design with an abstract class will create more problems that it solves. So the proposal here starts more humble as a mere suggestion for code organization.
- This is specific to the widgets that contain some sort of plot. Not all of them do, as an example, nwbwidgets.file.show_nwbfile just displays some text and is outside of the scope of the proposal here.
Proposal
My claim is that is useful to think about visualization widgets as coordination classes in charge composition, layout and interaction between controllers, data and plotting. The idea can be sumarized in the following diagram:
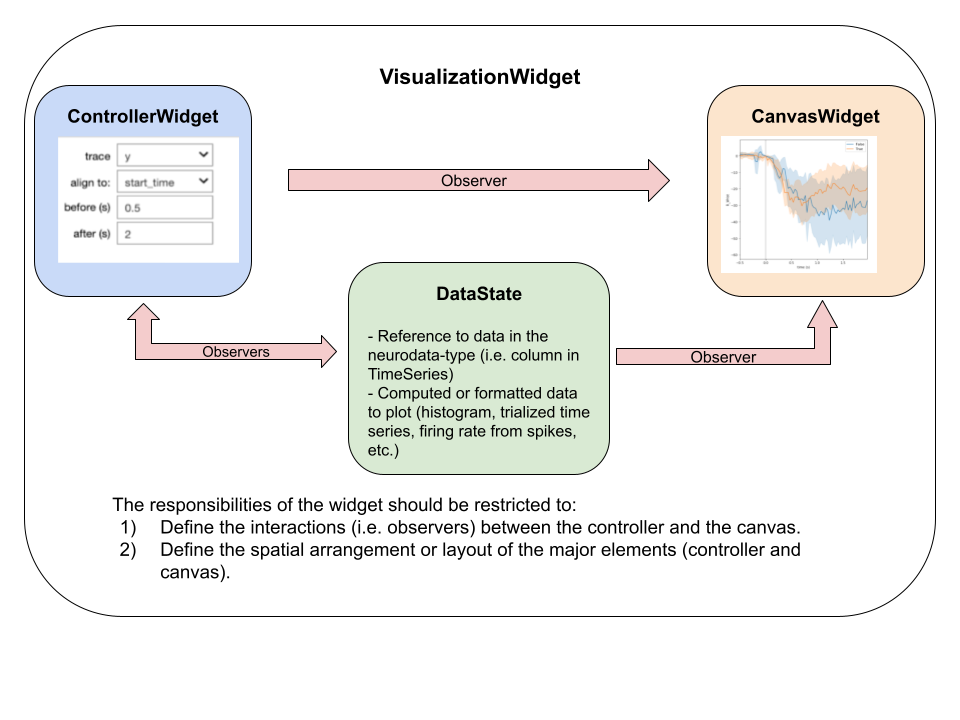
In brief, the role of the VisualizationWidget is to coordinate the interaction between a ControllerClass, a CanvasClass and the data extracted and processed from the neurodata types (i.e. a TimeSeries or a DynamicTable). A minor role of the VisualizationWidget is to define the layout between the controllers and the canvas (usually done with Box mechanism). The most important responsability of the VisualizationWidget is to define the interactions between the data and the canvass which is done with the jupyter widgets observer mechanism. Furthermore, I think we should aim to isolate the definition of the interactions (i.e. establishing them) from theircomputational and rendering actions. Their definitions are done in the VisualizationWidget class and their actions are done separately and called with a dedicated method to reduce coupling between these two functionalities. See the following diagram:
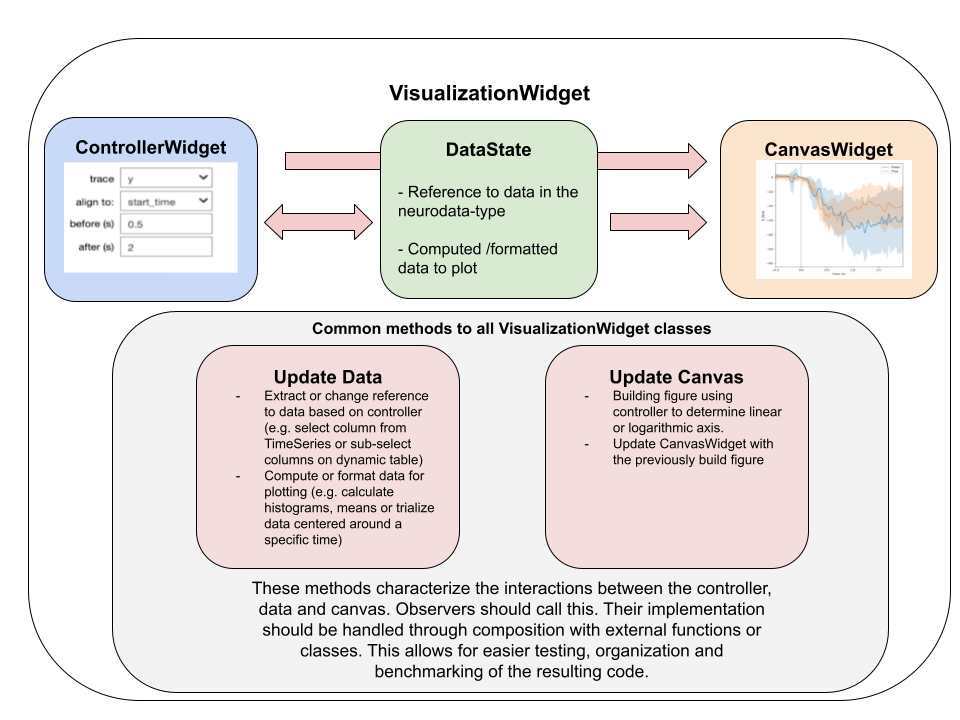
In more detail, the methods update_data (in charge of extracting and processing data according to the controller state) and update_canvas (in charge of building the plot and updating the CanvasWidget) are attached with the observer mechanism to the controller class (this is the definition of the interaction mentioned above) and they implement their actions with external functions (composition) for the sake of keeping the coupling of the code low. That is, for each VisualizationWidget instance there should be a separate stand alone function that is in charge of processing the data to make it plot-ready (i.e. extract the data from the units table and build a firing rate histogram) and a separate stand alone function that is in charge of buidling a plot (i.e. get a series of spikes and produce an histogram). The idea is that these functions should be called inside of update_data and update_plot respectively (their point of contact) but they can be analized, tested and benchmarked on their own keeping the coupling low and the code organized.
A bare-bones pseudocode-like implementation is shown now to drive the point home and hopefully make the idea clearer in case I missed something:
class VisualizationWidget(widgets.HBox):
    """
    The role of this class would be to define and coordinate the relationships between a controller and a computing and
    plotting functionality.
    """
    def __init__(self, neuro_data_type, foreign_controller, widget_kwargs, controller_kwargs):
        super().__init__()

        # Initialize controller
        if foreign_controller is None:
            self.controller = VisualizationWidgetController(neuro_data_type, **controller_kwargs)
        else:
            self.controller = foreign_controller

        # Initialize figure (could be a general placeholder)
        initial_figure = intialize_figure()
        self.canvas_widget = go.FigureWidget(initial_figure)

        # Build the layout of widget using HBox, VBox or GridspecLayout
        self.children = [self.control, self.canvas_widget]

        # Assign computing observers (alternatively could be done with widgets.Button)
        self.controller.widget_1.observe(self.update_data, names="value")
        self.controller.widget_3.observe(self.update_data, names="value")

        # Assign ploting observers (alternatively could be done with widgets.Button)
        self.controller.widget_x.observe(self.update_canvas, names="value")
        self.controller.widget_z.observe(self.update_canvas, names="value")

    def update_data(self):
        """
        This functions updates the state data, that is, the data to be plotted and the state of the widget.
        In more detail, when a relevant parameter in the controllers change this function should be called to
        recalculate the data necessary for plotting this.

        Also, this function could return -before the calculation- an estimation of memory or computational requirements
        and throw warning / stop when it is too large / slow.
        """

        ## Possible structure
        # 1) Estimate memory and computational resources [optional]
        # 2) Decide whether to run the computation [optional]
        # 3) Computer the new data state (that is, the data to be plotted in the figure widget)

        # extracted_data = extract_data_from_neurodata_types()  <- update the data
        # self.data_to_plot = external_formatting_function(extracted_data) <- format the data such that is ready for plotting
        pass

    def update_canvas(self):
        """
        This function updates the canvas_widget and its responsability is to generate the plot and render it on the
        figure widget.
        """

        ## Possible structure
        # 1) Have an external function that builds the plot at is. The idea is that this function could be used as a
        # stand alone for quick debugging and testing outside of the logic of this class (composition)
        # 2) Update the canvas widget

        # Use the data in the state as computed by the computing_update function
        #figure = external_plot_function(self.data_to_plot)
        # canvas_widget.update(figure)

        pass